| T O P I C R E V I E W |
| ullix |
Posted - 03/23/2019 : 04:06:44
A major overhaul behind the scenes, but the user of just a GMC counter will barely notice the difference. The last stop before the 1.0 release.
The Windows installation, though, has gotten much, much simpler with the support of the very latest Python and graphic toolkit; details in the manual.
All available for download at the GeigerLog site at SourceForge: https://sourceforge.net/projects/geigerlog/
Image Insert:
175426 bytes
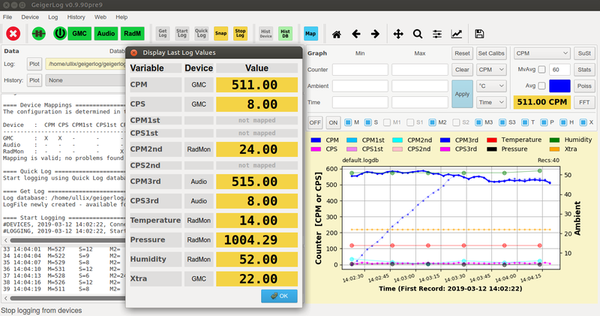
GeigerLog now supports multiple new devices, including I2C based sensors, more IoT devices, LabJack.
Of particular interest to Geiger aficionados will be the new support for audio-click signals from counters to collect CPS and CPM data, making classic counters, low cost counters, as well as the latest semiconductor counters available for handling and recording with GeigerLog. And all devices can be connected at the same time.
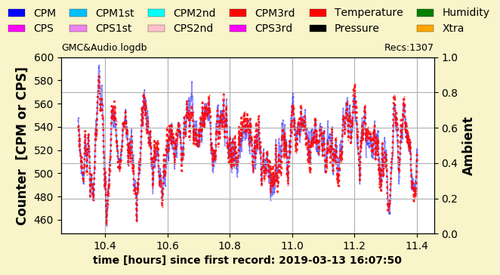
As the GMC counters offer both a digital output, as well as an audio-click output, they are a nice target to validate the AudioCounter performance of GeigerLog. Here an example for a GMC-300E+ counter, blue is digital connection, red is audio connection. No difference:
Image Insert:
115136 bytes
More thorough presentation and discussion in this article: GeigerLog-AudioCounter-Support https://sourceforge.net/projects/geigerlog/files/Articles/GeigerLog-AudioCounter-Support-v2.0.pdf/download
!!!!!!!!!!!!!!!!!!!!!!!!!!!!!!!!!!!!!!!!!!!!!!!!!!!!!!!!!!!!!!!!!!!!!!!!!!!!!!!!!
Finally the GeigerLog Version 1.0 has just been released. See at the usual place:
https://sourceforge.net/projects/geigerlog/
|
| 100 L A T E S T R E P L I E S (Newest First) |
| nonus |
Posted - 10/31/2024 : 10:32:28
Something strange with GeigerLog. I run the log with my database and the application crashes. In the fast log mode the program works a little longer, but then crashes.
https://drive.google.com/file/d/1NSl6-EWxTBkQ5uWJQFCAPE2OrAJIIIMU/view?usp=drive_link |
| ullix |
Posted - 10/21/2024 : 06:29:33
Do you want to know what your current electric power consumption is? Or what it had been during the last months?
GeigerLog can now read out Smart Meters, which are becoming the norm in households, and in particular in German households due to some new regulations benefiting Balcony Power Stations ("Balkonkraftwerke").
The required electronics are simple devices, based on ESP32 embedded CPUs, using the Tasmona operating system. The "Wattwächter" https://www.amazon.de/dp/B0DDHPZQPX is one of several examples for those devices.
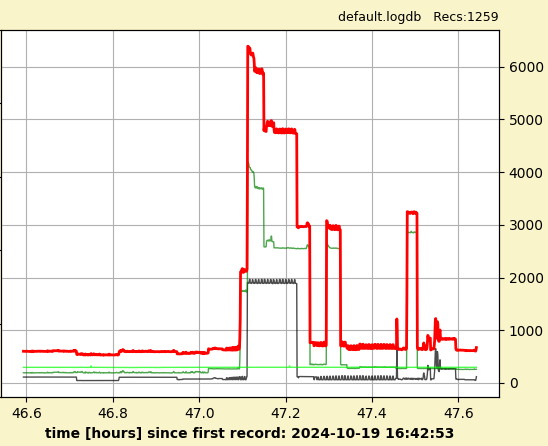
Attached is one example showing the total power (red), and the power on each of the 3 phases of the 3-phase electrical supply. The time-midpoint is when the wake-up clock strikes ;-) Right scale in Watt.
To use these devices, download GeigerLog pre-release 1.5.1pre13 (or a later version) from the GeigerLog Development site https://sourceforge.net/p/geigerlog/discussion/devel2/
The config file in the present pre13 download is configured for the Wattwächter, but those devices are all identical with respect to configuration or very much alike.
|
| nonus |
Posted - 10/04/2024 : 04:47:28
I created a ticket on sourceforge: https://sourceforge.net/p/geigerlog/tickets/7/ |
| ullix |
Posted - 10/04/2024 : 00:30:14
@nonus: GeigerLog should work on all Python of versions 3.10 or later. Bit size 32 or 64 should not matter (but 64 is recommended).
To understand what is going on in your case I suggest you file a ticket on the GeigerLog site at:
https://sourceforge.net/p/geigerlog/tickets/
This allows you to post files which I do need for review. Please, start GeigerLog with (which OS are you on? I suppose Windows?):
GeigerLog.bat -dvw devel
Log with GL for 2-3 min, then stop and exit. This will have created file geigerlog.proglog.devel. Please, post this file.
If you can't get to logging, please post what the terminal shows after you have tried to start GL in the above matter.
|
| nonus |
Posted - 10/03/2024 : 22:05:15
It doesn't work on Python 3.11 32 bit, many modules don't have a minimum version, for example, matplotlib. Do you have a build for 32 bit processors? I wanted to use intel Atom Z3735 or Atom Z8350. |
| ullix |
Posted - 08/23/2024 : 22:50:27
EDIT: I notice some peculiarity on your system, which I had missed before. It may take more effort to solve. I suggest you file a ticket on the GeigerLog site:
https://sourceforge.net/p/geigerlog/tickets/
and further discussion will be there.
###############
Your system Python is 3.13, and it is the only Python version, yet the Virtual Environment is based on Python3.12. That should be impossible! Had you made any Python changes during GeigerLog installation?
Another problem: Python3.13 is not released yet, and while Python itself is working ok, its package scipy, required for GeigerLog, does not yet work in this Python version.
There is nothing I can do about it.
You should uninstall Python3.13, and install one of the supported Python versions, 3.12, 3.11, 3.10, 3.9.
|
| ruslan |
Posted - 08/23/2024 : 14:43:19
New problem:
GeigerLog Startup -------------------- in SETUP mode ---------------------------
startup: Command Line: ['geigerlog.py', 'setup']
startup: System Python: python3.13
startup: Virtual Environment: '__venv1.5.1pre09'
startup: Virtual Environment: currently using Python version = 3.12.5
startup: Python Versions existing on this computer:
startup: /usr/bin/python3
startup: None of the installed Python versions are supported by GeigerLog!
startup: Supported versions are: python3.12, python3.11, python3.10, python3.9, python3.13
startup: See the GeigerLog manual for guidance on installing Python
ruslansalamatin@mbp-ruslan geigerlog %
|
| ullix |
Posted - 08/22/2024 : 22:29:41
@ruslan: Please, first try if it also occurs on the latest GeigerLog development
version. You find it here:
https://sourceforge.net/p/geigerlog/discussion/devel2/
Currently it is pre-release 09. |
| ruslan |
Posted - 08/22/2024 : 16:38:42
I have a problem with running GeigerLog on macOS - I receive the following error message: "/Applications/geigerlog/GeigerLog.sh: line 55: 35881 Segmentation fault: 11 $myvenv/bin/python3 geigerlog.py $1 $2 $3 $4 $5 $6 $7 $8 $9", along with a message that Python unexpectedly quits. Can someone help me with this? |
| WigglePig |
Posted - 08/21/2024 : 03:06:30
Indeed, I realised my error pretty quickly when playing around with the scaling. I don't have much choice regarding the monitor size and resolution since this is on a laptop PC; I could use an external monitor but then this would be very much less portable so I'm not keen on doing that really.
The context menu "move" and "resize" are greyed out in this context, presumably because the window is too large for the scaling.
Thanks for getting back to me and apologies for not digging around a bit before messaging you! |
| ullix |
Posted - 08/21/2024 : 02:17:40
So you have a 4k monitor and suffer from all the programs not really supporting this high resolution. And they don't, neither on Windows, nor Linux,
nor Mac. So you make a scaling of 250% in order to make it legible. Let's do some calcs:
A resolution of 3840x2160 pixel, after dividing by 250%, becomes a resolution of 1536x864.
The minimum height for GeigerLog Sub-Windows like Stats, Scat, Poiss etc is 900 pixel. Thus too much for your scaled Windows!
When you scale by 200% (not 250%) you end up with a resolution of 1920x1080, which now is the default size of today's monitors, and all GeigerLog windows will fit!
If this still doesn't show the programs/their text in the size you need, you may have purchased the wrong monitor. You need a physically larger
one, like 30+ inches, or even 40+ inches. Resolution is not so important; FullHD (1920x1024) is ok, (1920x1200 is better).
One last hope: on my Windows11 I see a "?" on the top-right end of the window. When I right-click on this, select "Move" and NOT use the
mouse, but the cursor keys, I can shift the window up/down/left/right as much as I want. Not sure if this is available in Windows10?

|
| WigglePig |
Posted - 08/20/2024 : 05:20:05
quote:
Originally posted by ullix
It is not really helping.
The stats window is coded for a size of H1100xH750. Displays today have a size of 1920x1080, so there should be ample space. But height-wise it should fit even on the minimal size supported by GeigerLog.
What is your screen size in pixels? Are you using any any OS-specific overall screen enlargement?
You see the scrollbar on the right side of the stats window. So you can shift the content up and down and see everything there is.
To enlarge or shrank the size of the text-fonts you can also do: press and hold the CTRL-key, and turn the mouse wheel as desired.
I'll make the window smaller in the next release, but it is on the brink of becoming inconvenient!
Next releases are pre-releases, and you find them here:
https://sourceforge.net/p/geigerlog/discussion/devel2/
Always take the last one available, but be aware that there may be bugs.
Apologies for the large screenshot!
MY screen size is 3840x2160 and the standard/default scaling for this unit is 250%. Reducing this to 200% or lower means I can see it all OK, including buttons and widgets but this makes all the text, etc, quite small. The slider doesn't help since widgets/buttons are at the bottom of the window which is forced off the bottom of the screen. |
| ullix |
Posted - 08/20/2024 : 03:39:37
It is not really helping.
The stats window is coded for a size of H1100xH750. Displays today have a size of 1920x1080, so there should be ample space. But height-wise it should fit even on the minimal size supported by GeigerLog.
What is your screen size in pixels? Are you using any any OS-specific overall screen enlargement?
You see the scrollbar on the right side of the stats window. So you can shift the content up and down and see everything there is.
To enlarge or shrank the size of the text-fonts you can also do: press and hold the CTRL-key, and turn the mouse wheel as desired.
I'll make the window smaller in the next release, but it is on the brink of becoming inconvenient!
Next releases are pre-releases, and you find them here:
https://sourceforge.net/p/geigerlog/discussion/devel2/
Always take the last one available, but be aware that there may be bugs. |
| WigglePig |
Posted - 08/20/2024 : 03:12:45
quote:
Originally posted by ullix
Yeah, this should not happen.
I don't see it on my test systems. Can you please point out again where it occurs, and I will work on a fix.
It seems to happen whenever there is a biggish window opened as a result of some action in the application. I have seen it when opening the extended configuration dialogue and also when requesting data stats.
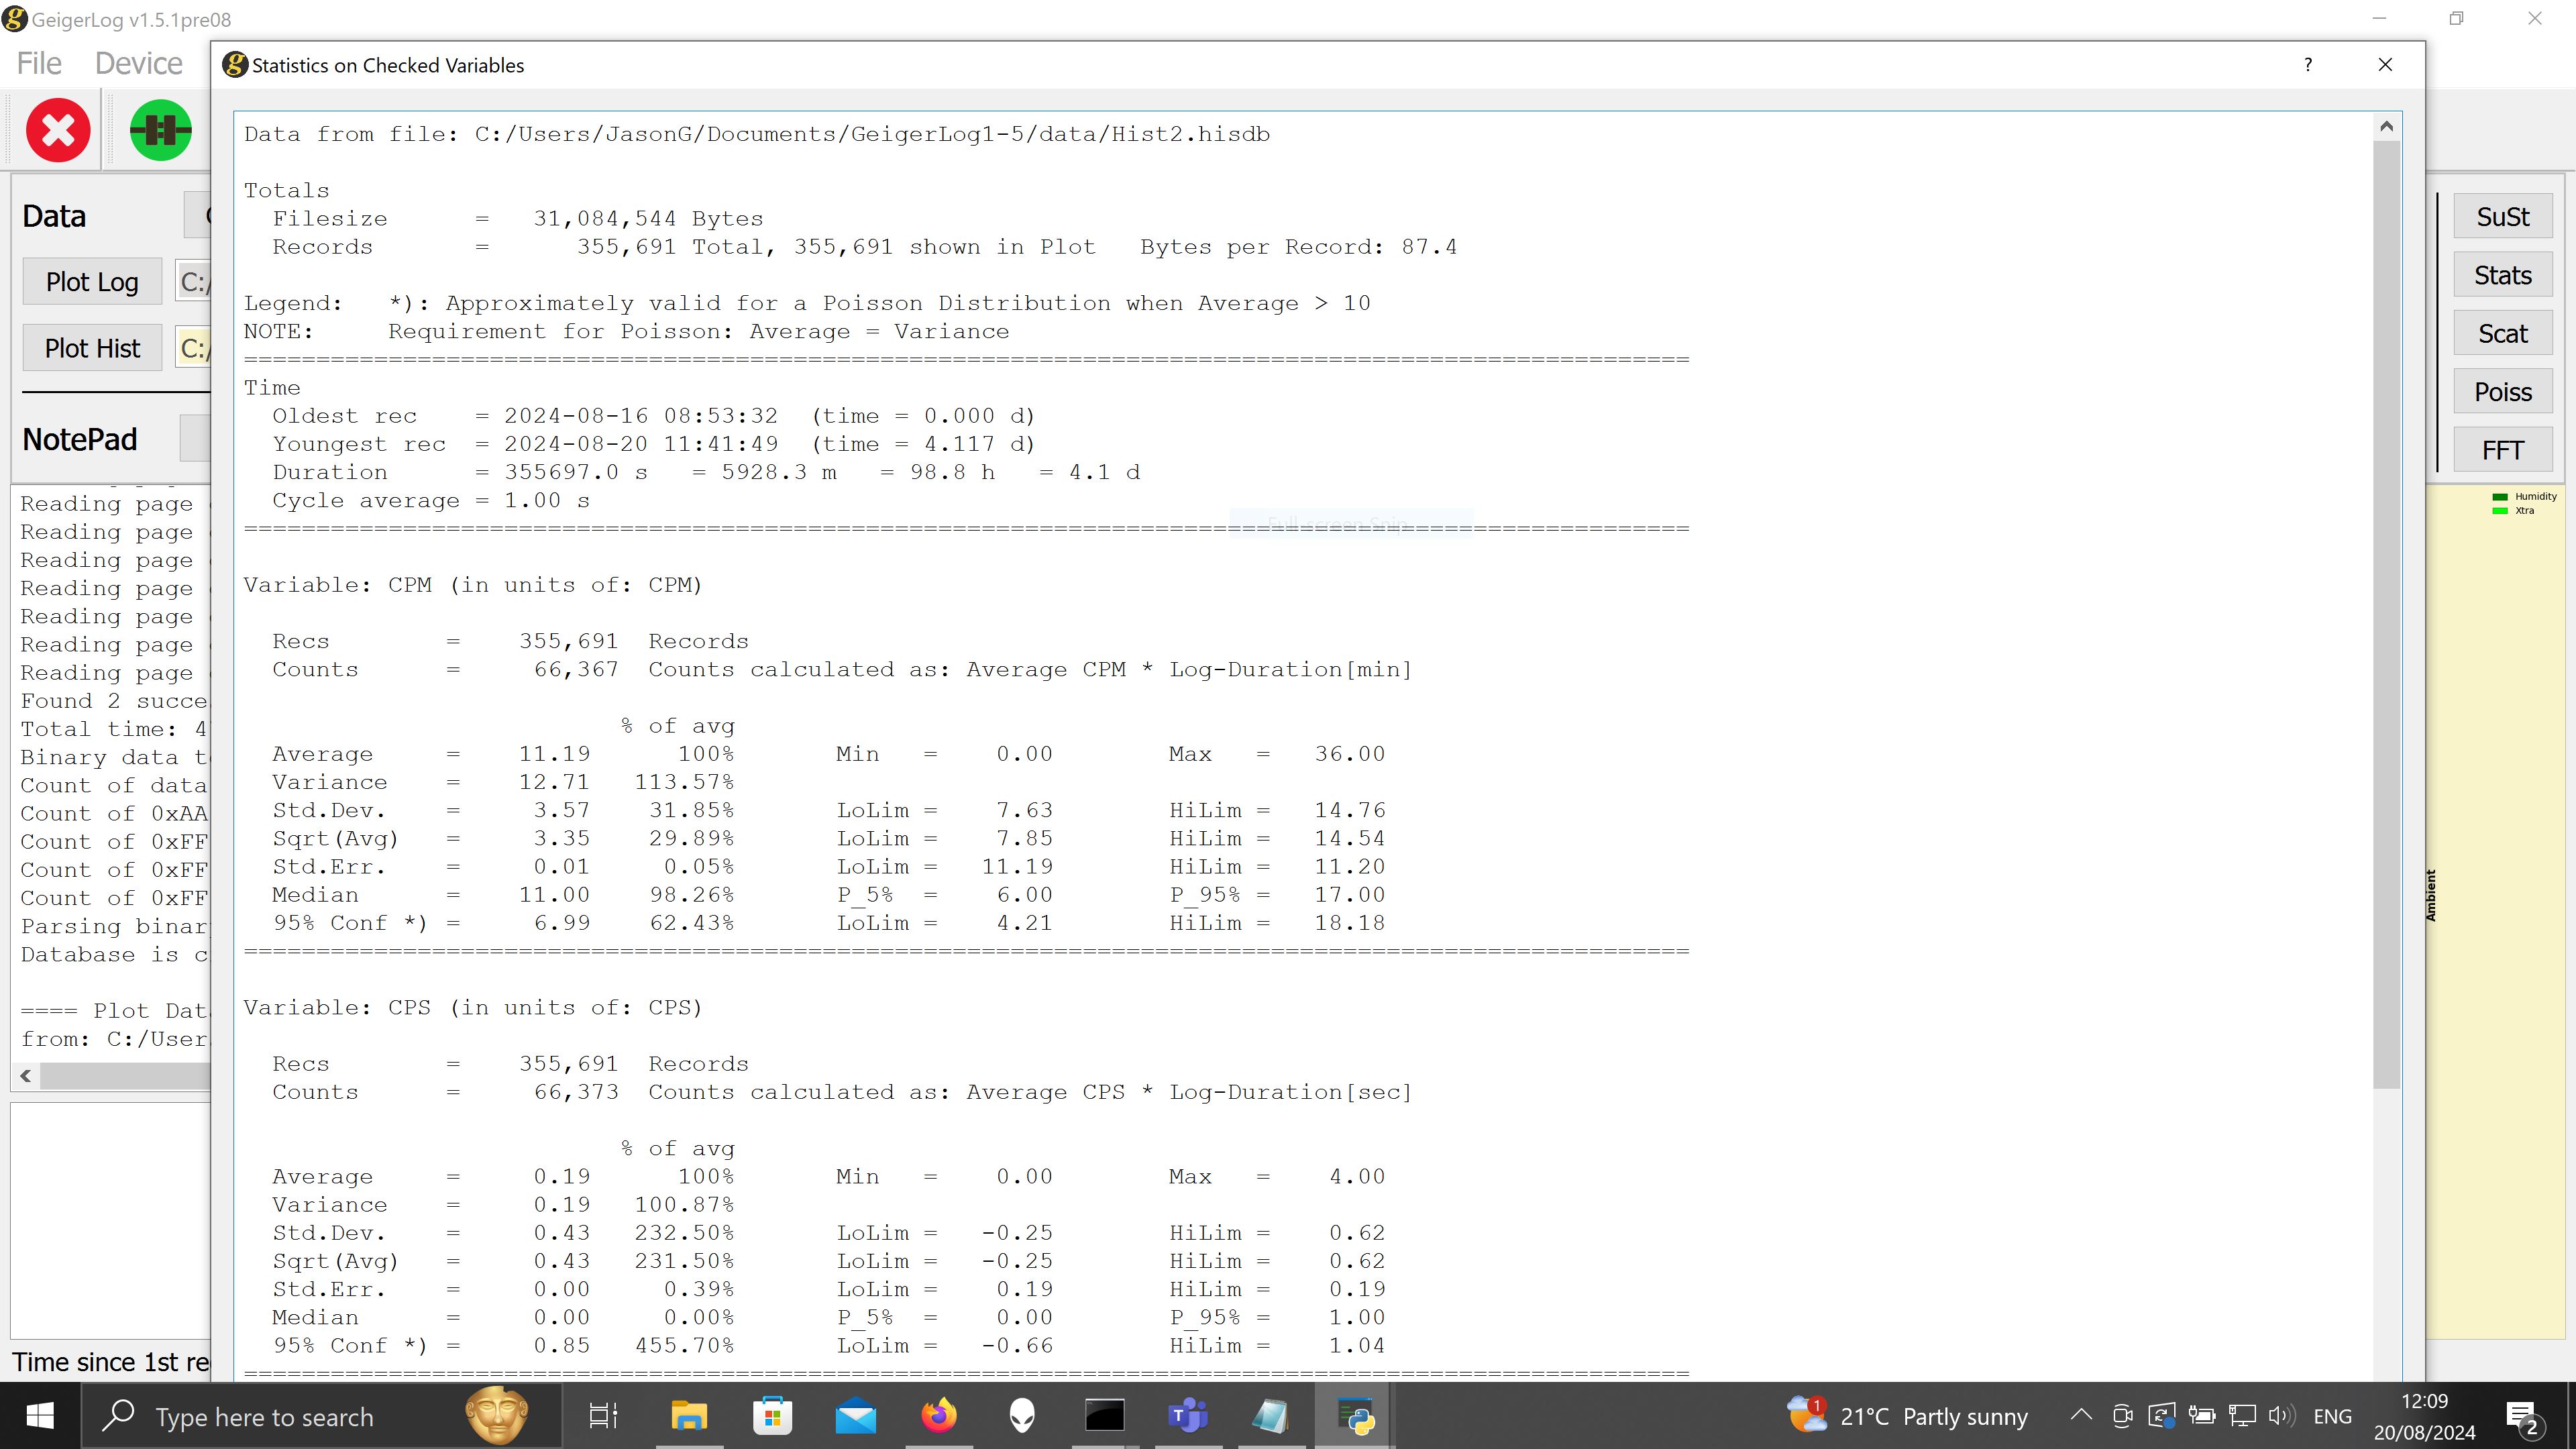
Here is an example where the window runs off the screen and cannot be resized or slid back into view.
Hope that helps! |
| ullix |
Posted - 08/20/2024 : 01:54:12
Yeah, this should not happen.
I don't see it on my test systems. Can you please point out again where it occurs, and I will work on a fix. |
| WigglePig |
Posted - 08/19/2024 : 23:47:49
Many thanks ullix, this software really is rather good and very useful.
I have a question regarding window sizing...I'm sure you may remember that we chatted about this some while back before the settings were rolled into the config file.
WHat I have noticed is that whilst the main window sizing, scaling, etc is absolutely fine there is an issue where sub-windows, like settings pages, etc, are too large to display on the screen so I can't see some of the widgets. There isn't any option to maximize/fit to screen/shuffle the window around so it's a bit problematic.
Do you have any tips? |
| ullix |
Posted - 08/16/2024 : 22:25:32
GeigerLog can send data to the server in the format which the server expects. It CANNOT reprogram the server!
You are posting the same question in multiple threads. This is NOT helpful! I continue at the other place. |
| nonus |
Posted - 08/16/2024 : 07:35:33
I'm wondering if it's possible to transfer radon gas readings to a gq map via the GeigerLog app? |
| ullix |
Posted - 07/13/2024 : 05:37:49
GeigerLog's latest (pre-)release now also supports GQ's EMF devices! Both Logging and History are possible (where supported by the device). See:
http://www.gqelectronicsllc.com/forum/topic.asp?TOPIC_ID=10559
|
| ullix |
Posted - 05/19/2024 : 07:45:27
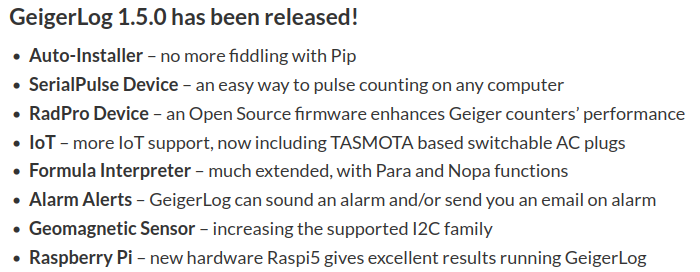
GeigerLog 1.5.0 is released today. Find it in the Files section on SourceForge: https://sourceforge.net/projects/geigerlog/
Quite a load of new features:
 |
| ullix |
Posted - 05/15/2024 : 07:56:38
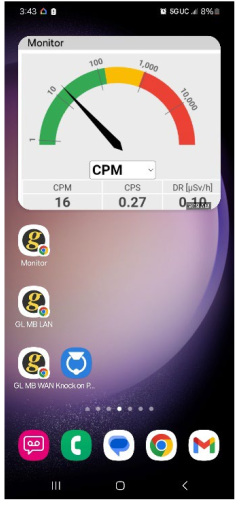
If you are interested in monitoring GeigerLog from your mobile phone, while GeigerLog is resting on a Cloud, you might want to look into this article
HOWTO - Using GeigerLog's Monitor feature on Your Mobile contributed by user Simon Harrison.
Find it on the Articles page https://sourceforge.net/projects/geigerlog/files/Articles/
quote:
his setup guide is for those who'd like to use their mobile smartphones to access Ullix’s GeigerLog Web Monitors. Specifically, these instructions demonstrate how to remotely access data from your GQ Electronics (GQE) GMC Geiger-counter via the GeigerLog software installed on a cloud based webserver, while connected to a public cellular or Wi-Fi network or other non-private wide area network (WAN).
Example:
|
| ullix |
Posted - 04/25/2024 : 23:12:02
The upcoming GeigerLog Version 1.5 does now understand some of the latest firmwares where a 6-point-calibration is used.
If you have a GMC-800, GMC-600, or GMC-500 with the latest firmware you might be interested to see the configuration.
Download a pre-release 1.5.0pre78 or later from here:
https://sourceforge.net/p/geigerlog/discussion/devel/ Anything not working as expected? Please, report.
This example from a GMC-600+ counter:
 |
| ullix |
Posted - 06/23/2023 : 03:34:52
GeigerLog has IoT support since very long, and this has just been updated to explicitly support 'Tasmota' devices.
First thing tested is a set of electric sockets, which allow switching (up to 3.6 kW loads!) and measuring voltage, current, power, cosine-phi and other stuff.
In my experience quite reliable at least for voltage, see this pic:
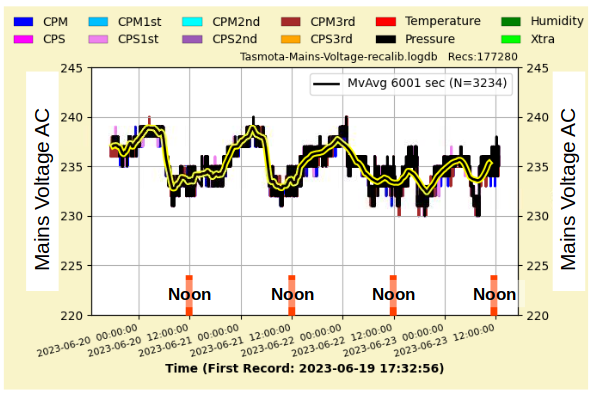
Though I am a bit surprised: where are the '220V' we are supposed to have? And do you notice the day-time cycle?
More on this topic on the GeigerLog site:
https://sourceforge.net/p/geigerlog/discussion/features/thread/d10076b63a/
And: a Tasmota based Geiger counter may be coming, made by the folks in Ukraine. Will be supported by GeigerLog, once available.
https://sourceforge.net/p/geigerlog/discussion/features/thread/02400c685d/
|
| StevenL |
Posted - 05/25/2023 : 02:46:32
Ullix,
Thank you for the great info. Although I am an experienced (mechanical) engineer, I am pretty much a beginner with the (modern) details of coding, data acquisition and electronics, at least at the fine detail level. For now I will stick with the Uno while I get up to speed on Arduino code and C++, but great idea to move on to more sophisticated boards with more features, eventually.
My main goal is to A) maybe move into the nuclear energy field (one of the reasons I am doing self-education on ionizing radiation) and B) develop some specific mechatronics projects for home (at least for now) use. I have a long way to go.
If I have any stats questions, I will will back to you.
Steven Lightfoot |
| ullix |
Posted - 05/25/2023 : 00:37:27
Steven, GeigerLog allows long-time recording of any data, be it Geiger counts or values like Temperature, Barometric Pressure, CO2, simulated data, and so on. If any statistical tool is missing for dealing with such time-course data, I will add it.
However, I don't see anything missing - speak up if you see a need!
For your playtime with Arduino I'd like to make a suggestion: skip the Uno and go with a serious chip, like the ESP32. It has much more power, much more memory, much more disk space, and it comes with WiFi by default (and Bluetooth). So e.g. getting the time, like from Atomic clock time servers, is no problem. And lots more.
Look for the "AmbioMon Device" in the GeigerLog config and code. This is an interface for a full blown ESP32 device, communicating either by WiFi or by Serial Port. It all works.
|
| StevenL |
Posted - 05/24/2023 : 06:55:24
Ullix,
I just wanted to add that I think your sw Geigerlog has a LOT of potential also as a statistical analysis tool. I dont know your plans for it, or if you are just noodling around, but I see it has real potential.
As I play more and more with Arduino, and start to get enviro data and other variable data, I would consider importing into Giegerlog to run some tests. What is holding me back for now, is that the Arduino Uno does not appear to have a DateTime function, and would need to interface with my PC, but I haven't figured out code yet to import DateTime via USB. I am not sure its easily possible.
Anyway, I like Geigerlog!
Steven Lightfoot |
| StevenL |
Posted - 05/23/2023 : 03:11:55
Ullix,
Thank you for all this. I now need to wrap up my Geiger work for six months, and move back to my Arduino work. In Arduino I need to be able to control some DC motors, and this is my top priority. In addition I am playing with the Arduino Uno random number generator (and random seeding) so all this discussion about random variables and Poisson has been helpful.
When I get access to some K salts, maybe later this summer, I will do some more tests (and with my kids who are interested). I may also upgrade to the next version of Geigerlog.
I have learned a lot, and will come back for more.
If you ever wish to contact me, I am Steven D. Lightfoot on LinkedIn.
Thank you. |
| ullix |
Posted - 05/22/2023 : 23:51:46
Correct.
In the meantime GeigerLog has got a more powerful feature to deal with alarms and reduce frequency of false alarms. One can now define that the average of the last 1 ... 60 readings is higher than a configured high alarm level, or lower than a configured low alarm level.
I put it as a challenge to you to determine the probability of the occurrence of 1, 2, 3, ... consecutive values being on average higher than a configured alarm-level = X!
P.S.: the FFT - data look excellent, and absolutely nothing to see ;-)
One of the rare occasions where the FFT does show an effect is posted here:
https://sourceforge.net/p/geigerlog/discussion/general/thread/b43896fc28/#7b62
It is about the memory-use swings in a long-run of GeigerLog on Windows.
|
| StevenL |
Posted - 05/22/2023 : 08:32:02
quote:
Originally posted by ullix
Wow, digging deep into the much loved Poisson statistics!
I figured my answer would need some attachments, which I couldn't post here, so I started an answer on the GeigerLog site under the heading:
GeigerLog as Doomsday Predictor
https://sourceforge.net/p/geigerlog/discussion/general/thread/2eee6dd990/
While this heading may not be fully serious, the content should be!
I think this quote reflects the most important restriction to do any Poisson-statistice-educated setting of alarm levels: quote:
... with a maximum of one false alarm per month on average.
which implies that you have to bite the bullet in defining how much nuisance you want to bear by understanding the nature of the statistics of radioactive decay.
Download data and spreadsheet to experiment with yourself.
P.S. one request: please avoid the "Reply with Quote" button in this forum whenever possible. This really blows up the thread for mostly no advantage. To quote single pieces from comments, which you may need for good reference, you can always use the "Insert Quote" button in the editor.
I finally had a chance to review the info you posted in Source Forge, and I agree with your approach. I love your work. I was assuming one could actually do the integration manually if you knew the Poisson equation parameter(s), but you used the Excel Poisson function which is easier and faster. You basically integrated backwards from infinity to until you got the total summed probability you initially proposed (1 event every two months), and then the corresponding CPM value was 42.
I got confused at first with the terminology 'false alarm', but you did get my meaning. The basic point is that with your assumed background radiation distribution, if you see a reading of 42 once every two months (but not more) you could assume this is background. If you saw a lot of 42s (more than one per 2 months) you could assume you were reading some rad source greater than background.
I have noted and filed all this, for future reference, thank you!
Steven Lightfoot, Eng.
|
| StevenL |
Posted - 05/22/2023 : 07:46:57
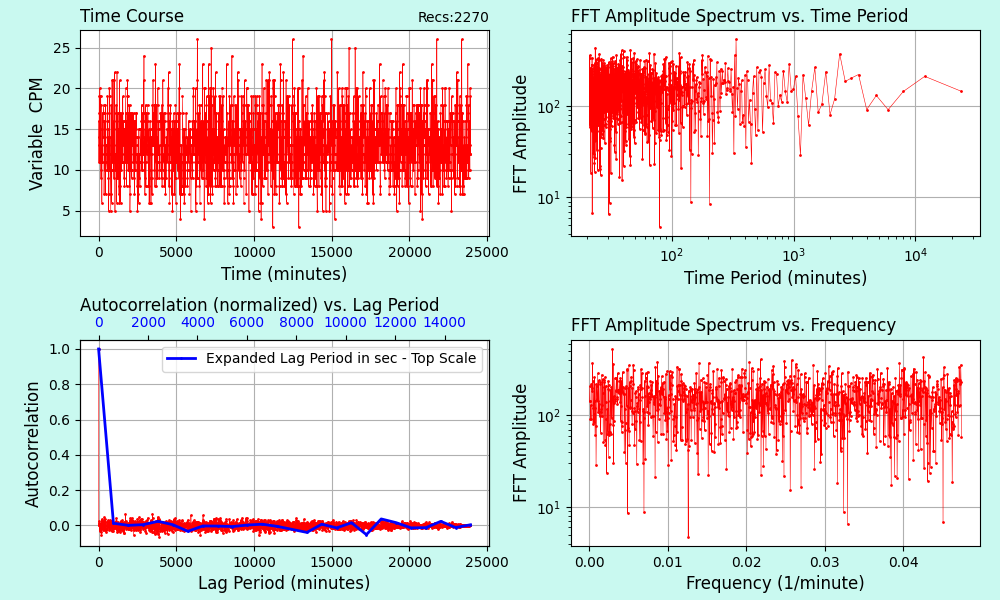
OK thank you, I sorted it out, using Open Office spreadsheet. I have 17 days of data at 10 min samples (undersampling per your guidance) and the Poisson looks good at R .995, and I am posting the FFT here below, which was the point of this exercise (to get some longitudinal data to see if there is any daily or other periodicity - which you advised not to expect).
I am not an FFT expert by any means, but based what I know within the frequency domain plot, it looks mostly noise and nothing is showing up. Any comments? Thanks as always, Steven Lightfoot
|
| ullix |
Posted - 05/21/2023 : 22:27:03
quote:
In your experience, what would be the easiest way to get and use Geiger map data in the exact csv form that Geigerlog requires?
Most of the time my universal tool for such tasks is Geany, an editor available for all OS: https://www.geany.org/
Depending on the layout of any data, a spreadsheet like Excel, Libreoffice, might also work.
|
| StevenL |
Posted - 05/21/2023 : 16:09:02
Indeed. I get it now, and it is clear, once I look back at your default db csv and the original one I am trying to use.
My confusion perhaps was exacerbated by the Guidance section in the dialog box which explicitly uses quotation marks to describe the format of the DateTime info. Maybe a future version could modify the Guidance to remove the quotation marks? Just a friendly suggestion.
So here is my next question - The format from the Geigermap data seems to come automatically with quotation marks, unless there is a way in the map data section to select the form of the csv data that I don't know about (which is entirely possible).
In your experience, what would be the easiest way to get and use Geiger map data in the exact csv form that Geigerlog requires?
All help is greatly appreciated!
Steven Lightfoot |
| ullix |
Posted - 05/21/2023 : 04:00:39
I know, the obvious is sometimes hard to see ...
#  Index,        DateTime,      CPM,      CPS
   0, 2019-01-11 19:32:14,      181,        6
   1, 2019-01-11 19:32:18,      197,        3
How many quotation marks (like >"<) do you see in my sample?
And in yours?
"2023-05-16 20:48:40","14","12.97","0.09","45.314234","-75.9219635"
"2023-05-16 20:38:37","16","12.97","0.10","45.314234","-75.9219635"
"2023-05-16 20:28:35","11","12.97","0.07","45.314234","-75.9219635"
|
| StevenL |
Posted - 05/21/2023 : 03:22:05
Cool, thx. OK, so here goes. I was able to read in your default db file in CSV, doing as required, I selected columns 1 and 2 in this case, to get Gate Time and then CPM.
For my own case, I was simply trying to read in the direct output from the GMCmap data file, downloaded. The top few lines are as follows:
# DateTime, CPM, ACPM, uSv/h, Latitude, Longitude
"2023-05-16 20:48:40","14","12.97","0.09","45.314234","-75.9219635"
"2023-05-16 20:38:37","16","12.97","0.10","45.314234","-75.9219635"
"2023-05-16 20:28:35","11","12.97","0.07","45.314234","-75.9219635"
Unless I am misreading something, the DateTime format looks correct, and when I try to try to read in based on dialog box guidance, I chose columns 0 and 1 to see the same data. It appears to read in, no errors shown, but no graph shows up, and when I print out the data in the log monitor, it shows that the CPM has been read in, but not the DateTime.
I must be making an error, even an obvious one, but I am missing it. I looked at the default db csv and their are more header lines that I dont really understand, but I assumed the headers (and in my case there is only one) are ignored. I assumed the # sign in the header is basically a comment line that Geigerlog ignores.
Any idea? Am I simply being obtuse? It happens :)
Steven Lightfoot (PS: I love your software). |
| ullix |
Posted - 05/20/2023 : 23:14:55
@Steven: please post a few lines of your CSV file.
It looks like your DateTime column isn't what is expected. It has to look like this:
#  Index,        DateTime,      CPM,      CPS
   0, 2019-01-11 19:32:14,      181,        6
   1, 2019-01-11 19:32:18,      197,        3
|
| StevenL |
Posted - 05/20/2023 : 12:24:37
quote:
Originally posted by ullix
I also believed to see a periodicity in the time course, which made me add the FFT option. Nope, nothing, just plain statistics!
Well, this isn't true: take a light sensitive tube and measure for a couple of days - and then you have it!
Hi Ullix, I now have two weeks or so of data, from Geigerlog itself, and also from the GQ map function, and downloaded that data in CSV. I will FFT it once I get it sorted....
I have read the manual, and studied the CSV import dialog box, for some reason it wont import my CSV file correctly, even though I have set the correct columns for DateTime and CPM, and the data in the CSV file is in the correct format (for DateTime, as described). Any ideas why it cant see the DateTime data? It picks up the CPM data. It wont graph any data because the DateTime is missing, but I can see it all when I print the log, and its clear its not picking up DateTime.
Thanks for any clues. Steven Lightfoot |
| StevenL |
Posted - 05/07/2023 : 15:25:27
Thanks. I am collecting longitudinal background data at the moment, I will eventually report back with findings.
Steven Lightfoot |
| ullix |
Posted - 05/06/2023 : 00:40:32
I also believed to see a periodicity in the time course, which made me add the FFT option. Nope, nothing, just plain statistics!
Well, this isn't true: take a light sensitive tube and measure for a couple of days - and then you have it! |
| StevenL |
Posted - 05/02/2023 : 13:23:37
Ullix,
Thanks for this, I will study it and comeback, maybe take awhile.
PS: I am really curious to try the FFT function next, to see if there any periodicity to the readings. I am wondering if my background changes from night to day.
Cheers, Steve |
| ullix |
Posted - 05/02/2023 : 05:53:45
Wow, digging deep into the much loved Poisson statistics!
I figured my answer would need some attachments, which I couldn't post here, so I started an answer on the GeigerLog site under the heading:
GeigerLog as Doomsday Predictor
https://sourceforge.net/p/geigerlog/discussion/general/thread/2eee6dd990/
While this heading may not be fully serious, the content should be!
I think this quote reflects the most important restriction to do any Poisson-statistice-educated setting of alarm levels: quote:
... with a maximum of one false alarm per month on average.
which implies that you have to bite the bullet in defining how much nuisance you want to bear by understanding the nature of the statistics of radioactive decay.
Download data and spreadsheet to experiment with yourself.
P.S. one request: please avoid the "Reply with Quote" button in this forum whenever possible. This really blows up the thread for mostly no advantage. To quote single pieces from comments, which you may need for good reference, you can always use the "Insert Quote" button in the editor.
|
| StevenL |
Posted - 05/01/2023 : 08:52:17
quote:
Originally posted by Damien68
the cumulative curve is very interesting.
consider the following problem, to make an alarm that is triggered in the event of an abnormal increase in the CPM rate:
- if for example I have an average CMP of 13.3CPM,
- if I wish to have the highest possible sensitivity but with a maximum of one false alarm per 2 month on average.
I am not specialized in statistics but I think that my reasoning must be good, the goal is to define a CPM max threshold to trigger an alarm:
-> an average of one false alarm per 2 month would be equivalent to saying that the cumulative probability during a month of having all the CPMs below the defined threshold would be 0.5, this is not strictly exact because we can have also several false alarms in the same month, but because the probalility are very low we can consider this as an good approximation.
-> we consider that we observe a value of CPM every minute and during a month we will therefore have 30.5*24*60 samples = 43920 CPM samples.
-> because the CPM values are all uncorrelated, the probability that all CPM values are below the threshold is equal to the discrete probability of obtaining this condition powered by the number of samples.
=> the overall probability of not triggering an alarm during a month is therefore according to the assumptions: 0.5
=> the discrete probability for each sample of CPM that it is lower than the Max threshold must therefore be 0.5^(1/43920) = 0.9999842
=> by using the black Geigerlog curve (or more by using its formula) we can then define the CPM Max threshold corresponding to the cumulate of (0.9999842 * Npopulate).
Ullix, is that correct?
EDIT: using GeigerLog's formula of the cumulative curve for previous calculations, there is certainly a simplification by Npopulate to be made.
Suggest a Max threshold of CPM according to criterias could be a new feature in GeigerLog.
Hi Damien, more or less you have described what I am after. The ability to determine if a rare and unusually high reading of CPM is part of the background set, as determined by the Poisson equation that Geigerlog determines. I wasnt thinking of setting an alarm, but that would be an obvious thing one could do.
I am using Geigerlog 1.3.0 (a year old) and cant see a cumulative probability curve, wonder is that a feature in more recent versions of Geigerlog?
I am still playing with the basics of Geigerlog 1.3.0, and once a comfortable with all it features, I will come back. It is very good, and has the potential to be SUPER powerful.
I dont code in Python, so I may one day take a look at the Poisson function code for Geigerlog, but not for now, I am too busy learning Arduino/C++.
Steven Lightfoot
|
| Damien68 |
Posted - 05/01/2023 : 06:38:02
ADD:
to adjust alarms there is always a compromise to be made between:
- reaction time
- the sensibility
- reliability (probability of false alarms)
in fact to optimize this compromise, there is the solution which consists in having multiple alarm triggers working together at the same time for example:
- Max over one second (CPS)
- Max over 2 consecutive seconds (2CPS)
- Max over 8 consecutive seconds (8CPS)
- Max over one minute (CPM)
- Max over 2 consecutive minute (2CPM)
- Max over 8 consecutive minute (8CPM)
- Max over 60 consecutive minute (60CPM)
...
for each trigger it is necessary to calculate its optimum value according to background and reliability criteria (thanks to GeigerLog, we know how to do it).
there will then be fast but not very sensitive triggers and other slower but more sensitive ones.
unless it is integrated directly into the counters, it could be an another additional feature of GeigerLog |
| Damien68 |
Posted - 05/01/2023 : 05:23:02
the cumulative curve is very interesting.
consider the following problem, to make an alarm that is triggered in the event of an abnormal increase in the CPM rate:
- if for example I have an average CMP of 13.3CPM,
- if I wish to have the highest possible sensitivity but with a maximum of one false alarm per month on average.
I am not specialized in statistics but I think that my reasoning must be good, the goal is to define a CPM max threshold to trigger an alarm:
-> an average of one false alarm per month would be equivalent to saying that the cumulative probability during a month of having all the CPMs below the defined threshold would be 0.5, this is not strictly exact because we can have also several false alarms in the same month, but because the probalility are very low we can consider this as an good approximation.
-> we consider that we observe a value of CPM every minute and during a month we will therefore have 30.5*24*60 samples = 43920 CPM samples.
-> because the CPM values are all uncorrelated, the probability that all CPM values are below the threshold is equal to the discrete probability of obtaining this condition powered by the number of samples.
=> the overall probability of not triggering an alarm during a month is therefore according to the assumptions: 0.5
=> the discrete probability for each sample of CPM that it is lower than the Max threshold must therefore be 0.5^(1/43920) = 0.9999842
=> by using the black Geigerlog curve (or more by using its formula) we can then define the CPM Max threshold corresponding to the cumulate of (0.9999842 * Npopulate).
Ullix, is that correct?
EDIT: using GeigerLog's formula of the cumulative curve for previous calculations, there is certainly a simplification by Npopulate to be made.
Suggest a Max threshold of CPM according to criterias could be a new feature in GeigerLog. |
| StevenL |
Posted - 05/01/2023 : 03:55:20
quote:
Originally posted by ullix
Are you looking for a Cumulative Distribution function? Here is one on user data, background recording In Japan with a GMC600 Geiger counter.
In black is the Cumulative Poisson function.
Thanks for this info, I will think more about this, and come back to you. |
| ullix |
Posted - 05/01/2023 : 00:38:04
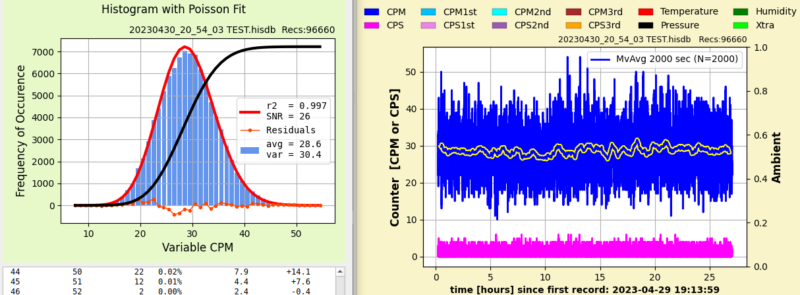
Are you looking for a Cumulative Distribution function? Here is one on user data, background recording In Japan with a GMC600 Geiger counter.
In black is the Cumulative Poisson function.
 |
| StevenL |
Posted - 04/29/2023 : 07:45:09
quote:
Originally posted by ullix
@Steve: I have a hunch of what you are trying to achieve, and I think it is already present in the 1.5 series of GeigerLog. The currently latest pre-release (#30) is available at: https://sourceforge.net/p/geigerlog/discussion/general/thread/beafedc7b1/?page=4#c2ed
The formula interpreter has made big steps forward. Activate the "Formula Device" with variable "Pressure", and in the configuration file, section "[ValueFormula]" enter "Press = EXPONENTIAL(100)" (the pre-release 30 has all this already).
Then start GeigerLog with:
python geigerlog nopoisson
This will create an Exponential Function for the time-differences in ms between two successive count events at CPS=100. This is the base for a true Poisson function for an average CPS=100.
This is the result:
In the bottom part I (mis-)used the "Histogram with Poisson Plot" graph to show this distribution. It is NOT Poissonian, of course, it is exponential! To not become confused with the red lines of an attempted Poisson plot, the "nopoisson" command takes care of removing it.
For CPS=100 the average time between 2 counts is 10.0 ms. And you see the average of this exponential distribution is close with 9.92 ms for 2139 counts.
You can do this for other count rates as well, and add probabilities. But once you have gotten that far, you will realize that you don't need GeigerLog, nor Poisson, but only a few exp() functions in an Excel sheet ;-).
Thanks for this, I will study it.
Let me try to explain what exactly I want to do:
Here is a sampling of background from yesterday with 600 readings over the day:
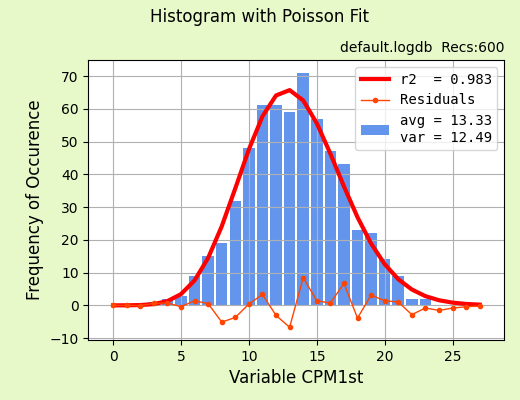
You can see that the avg is 13.3 and based on the fitted Poisson curve (with a good R2), the upper limit of possible readings ends at about 25.
So I have two questions:
A) It should be possible to actually get all the info for the Poisson function Y=f(x, lambda) so that you could presumably integrate it and determine the probability of a reading above, say, 25 in this case. How can we do this Geigerlog, any version?
B) My main question is, in my example, if we get a reading of 30, what is the probability it is from background radiation? I would say that the probability of a reading of 30 based on this Poisson function is very low, but non-zero, so if we saw one only reading of 30, we might assume it is background. BUT if we got a reading of 40, the probability of IT happening really IS zero for this Poisson function, so we could conclude that we were picking up something real. This is my basic question.
Any thoughts or insights are welcome. Thank you.
Steven Lightfoot |
| ullix |
Posted - 04/29/2023 : 04:45:57
@Steve: I have a hunch of what you are trying to achieve, and I think it is already present in the 1.5 series of GeigerLog. The currently latest pre-release (#30) is available at: https://sourceforge.net/p/geigerlog/discussion/general/thread/beafedc7b1/?page=4#c2ed
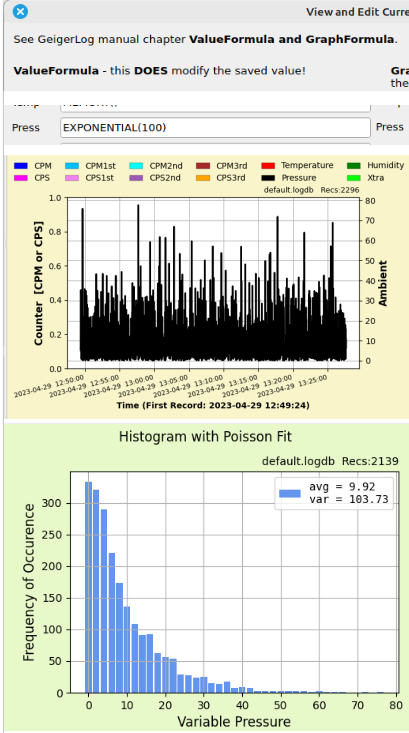
The formula interpreter has made big steps forward. Activate the "Formula Device" with variable "Pressure", and in the configuration file, section "[ValueFormula]" enter "Press = EXPONENTIAL(100)" (the pre-release 30 has all this already).
Then start GeigerLog with:
python geigerlog nopoisson
This will create an Exponential Function for the time-differences in ms between two successive count events at CPS=100. This is the base for a true Poisson function for an average CPS=100.
This is the result:

In the bottom part I (mis-)used the "Histogram with Poisson Plot" graph to show this distribution. It is NOT Poissonian, of course, it is exponential! To not become confused with the red lines of an attempted Poisson plot, the "nopoisson" command takes care of removing it.
For CPS=100 the average time between 2 counts is 10.0 ms. And you see the average of this exponential distribution is close with 9.92 ms for 2139 counts.
You can do this for other count rates as well, and add probabilities. But once you have gotten that far, you will realize that you don't need GeigerLog, nor Poisson, but only a few exp() functions in an Excel sheet ;-).
|
| StevenL |
Posted - 04/29/2023 : 04:14:27
quote:
Originally posted by ullix
GeigerLog is Open Source, so you are welcome to scavenge it for parts :-)
You'll find the Poisson stuff in file gstat_poisson.py .
OK thanks. Good to know. At the moment I am teaching myself Arduino/C++ so modifying Geigerlog is beyond my capabilities at the moment. I now have re-read the manual, and it does appear you have set up a function to provide the lambda, or that there is any ability to determine probabilities that any reading is above background. I expect this is possible to do, it just hasnt been added as a feature.
If I am incorrect, please advise.
Anyway, I am now off to see if I can see any statistical delta between background and some bags of dried plantain chips!!!
Steve
|
| ullix |
Posted - 04/28/2023 : 22:59:27
GeigerLog is Open Source, so you are welcome to scavenge it for parts :-)
You'll find the Poisson stuff in file gstat_poisson.py . |
| StevenL |
Posted - 04/28/2023 : 04:49:40
quote:
Originally posted by ullix
Welcome back, and thanks for the good words.
Notice that an evaluation of GeigerLog 1.5.0 is ongoing. You find the lastest pre-releases in this topic:
https://sourceforge.net/p/geigerlog/discussion/general/thread/beafedc7b1/
Begin searching the posts from the end for the latest pre-release. It is already very stable. As of this moment latest version is pre25, but this may change soon.
Cool. One thing I want to do is to A) Get the lambda for the Poisson equation for my data set, and B) be able to automatically calculate the probability of getting various CPM readings (or ranges of readings to the right from a given to number for infinity). Its not clear that Geigerlog can do this, but I WILL read the manual and do thorough study of what Geigerlog can do.
|
| ullix |
Posted - 04/28/2023 : 00:17:57
Welcome back, and thanks for the good words.
Notice that an evaluation of GeigerLog 1.5.0 is ongoing. You find the lastest pre-releases in this topic:
https://sourceforge.net/p/geigerlog/discussion/general/thread/beafedc7b1/
Begin searching the posts from the end for the latest pre-release. It is already very stable. As of this moment latest version is pre25, but this may change soon.
|
| StevenL |
Posted - 04/27/2023 : 08:38:25
Hello Ullix! I have been offline for close to one year, due to other life priorities. I am finally and finally ready to start using Geigerlog v 1.3.0 which I had managed to get installed and operating last time I was working this issue. Now I am ready to use it! I am really pleased with it, and once I have my data and Poisson curves completed, I may try to your updated version. For now, I just need to to get my work done. I just wanted to thank you again for having developed this really great and useful software. Steven Lightfoot, Kanata/Ottawa, Ontario, Canada. |
| ullix |
Posted - 04/17/2023 : 04:34:46
Using a GMC counter's WiFi to send its data in your local Network
Many people tried to use the WiFi capability of some GMC counters to collect data on their local network, but this is riddled with problems. A workaround is offered, see GeigerLog manual, chapter "Redirection for GMC counters". It works, but it is complex and difficult to do.
Beginning with pre-release geigerlog-v1.5.0pre25.zip I am offering a tiny Python program, which acts as a relay between the GMC counter and GeigerLog. This is much, much simpler to do, no fiddling with "unsafe-made" Apache Servers, server configuration and PHP programming! The program is GLrelay.py, which you find in the gtools directory of a GeigerLog installation.
All you need to do is to activate the WiFiClient Device in the GeigerLog configuration (Note: slightly different configuration from before!), leave all things on 'auto', tell the counter where to send data to, and start GLrelay.py (as Admin!). You can watch the incoming data on the GeigerLog computer, or even on you Smartphone, monitoring GeigerLog.
Find full explanation in a mini-manual GeigerLog-GLrelay Instructions v1.0.pdf at the same place. It should provide all the necessary guidance. If not, let me know!
Download from the Evaluating GeigerLog Version 1.5 topic in the SourceForge discussion. The currently latest release is this: https://sourceforge.net/p/geigerlog/discussion/general/thread/beafedc7b1/?page=3#d8a6
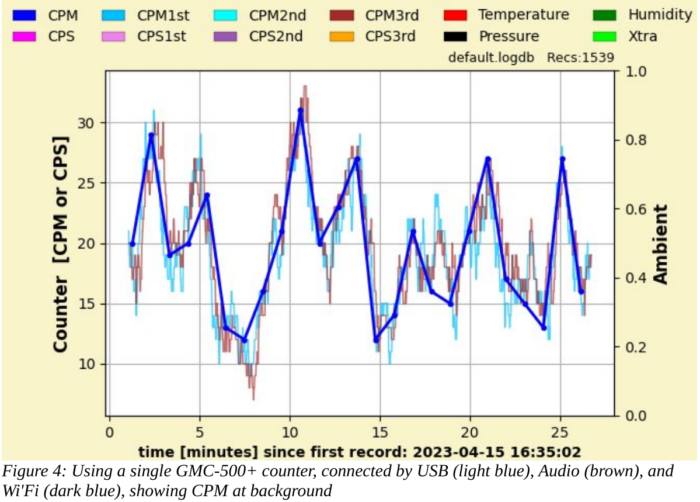
You now can get data from a GMC counter via USB cable, audio cable, or WiFi, each with the same ease. And simultaneously, if you want to go wild, as shown in the picture!
 |
| ullix |
Posted - 04/07/2023 : 01:42:06
Users of GeigerLog 1.4.X can now upgrade to GeigerLog v1.4.3.
All users of a GMC-600+ counter, as well as users of the new "S" series of GMC-3XX counters should apply this update.
You find it at the usual place https://sourceforge.net/projects/geigerlog/files/. Unzip and read the README.
Unfortunately, I haven't gotten much feedback from GMC-320S users. If any problems come up, please let me know. Preferred site is "General Discussion" at GeigerLog's Discussion site https://sourceforge.net/p/geigerlog/discussion/
You could also download a pre-release of the upcoming GeigerLog 1.5. As the manual isn't ready yet, you won't know what the new features are, but all that worked in 1.4.X should work here as well. It seems to now be stable enough for regular use.
You can download from the "Evaluating GeigerLog Version 1.5" discussion at https://sourceforge.net/p/geigerlog/discussion/general/thread/beafedc7b1/
There are multiple pre-releases. Always take the last one.
|
| ihab17 |
Posted - 04/03/2023 : 06:45:50
quote:
Originally posted by ullix
You are invited and encouraged to take part in the evaluation of upcoming GeigerLog 1.5.
Whatever you have as counter, I2C device, Raspberry Pi computer can help. The latest GMC-300X counters are one center of attention.
It happens here:
https://sourceforge.net/p/geigerlog/discussion/general/thread/beafedc7b1/
The latest pre-release of GeigerLog is available for download.
Hats off my friend. Thank you |
| ullix |
Posted - 04/01/2023 : 01:49:40
You are invited and encouraged to take part in the evaluation of upcoming GeigerLog 1.5.
Whatever you have as counter, I2C device, Raspberry Pi computer can help. The latest GMC-300X counters are one center of attention.
It happens here:
https://sourceforge.net/p/geigerlog/discussion/general/thread/beafedc7b1/
The latest pre-release of GeigerLog is available for download.
|
| EmfDev |
Posted - 03/15/2023 : 09:39:26
Thank you ullix, I will check it. |
| ullix |
Posted - 03/14/2023 : 00:18:49
Exactly what it says: the Python module 'soundfile' is required, but apparently not installed on your computer.
Please, follow installation instructions in the GeigerLog manual in chapter "Appendix I – Installation".
It might be curable as simply as giving the command:
python -m pip install -U soundfile
If this doesn't help, I need Operating System, version, Python version and full error messages.
I recommend to use "GLpipcheck.py" which you find in the subfolder "gtools" in the GeigerLog installation directory. This tells you if the installation is complete.
|
| EmfDev |
Posted - 03/13/2023 : 12:02:32
Hi @ullix, what does the "ModuleNotFoundError: No module named soundfile" mean? |
| vyzbick |
Posted - 01/28/2023 : 07:05:03
Hi Ullix,
So so sorry for the screen-overwhelming photos. I had no idea they would post so huge but since I saw your post I was able to shrink them and edit my post. I will try as you suggested. Thanks!
quote:
Originally posted by ullix
@vyzbick: Please, please, please: shrink your pics to a maximum width of near 800 pixel! Everything becomes awfully hard to read with such giant pics!
I suggest: first do a Factory Reset, and then use GeigerLog and create a bug report file as described in the GeigerLog manual chapter "Problems, Bugs, and Bug Reports" and post file on Sourceforge Discussions:
https://sourceforge.net/p/geigerlog/discussion/general/
Registering at Sourceforge makes it easier, but you can post without it. The your post goes into moderation.
|
| ullix |
Posted - 01/28/2023 : 01:07:56
@vyzbick: Please, please, please: shrink your pics to a maximum width of near 800 pixel! Everything becomes awfully hard to read with such giant pics!
I suggest: first do a Factory Reset, and then use GeigerLog and create a bug report file as described in the GeigerLog manual chapter "Problems, Bugs, and Bug Reports" and post file on Sourceforge Discussions:
https://sourceforge.net/p/geigerlog/discussion/general/
Registering at Sourceforge makes it easier, but you can post without it. The your post goes into moderation.
|
| vyzbick |
Posted - 01/27/2023 : 10:21:40
Hi Ullix,
I know it has been a couple of months since my question and your reply, but I wanted to make sure I took full advantage of working through "Problems, Bugs, and Bug Reports". as you suggested. I was finally able to get it to open on a different Macbook Pro (2011 13") running MacOS Catalina. I was then able to get it to connect to the GMC 600+, but no matter what I tried, I couldn't get it to show the CPM data in the app. I tried starting the log and it still showed only zeros all across the board. I tried the On/Off button in the app and was really surprised to see that it deleted all saved data on the 600+ (lesson learned there!). Since then, I can't get the 600+ to send data via wifi to the GMCmap as it did before that, and it still shows only zeros in the app despite the unit itself showing the current CPM. Below is a photo of the unit (connected) next the app showing only zeros while running along with a screenshot taken a few minutes later. I would appreciate any help you can offer about how to get it to show the data in the app as it is on the unit. Thanks so much!
Vance
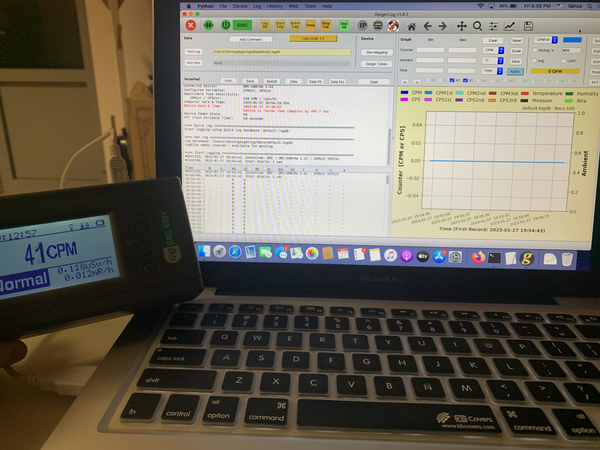
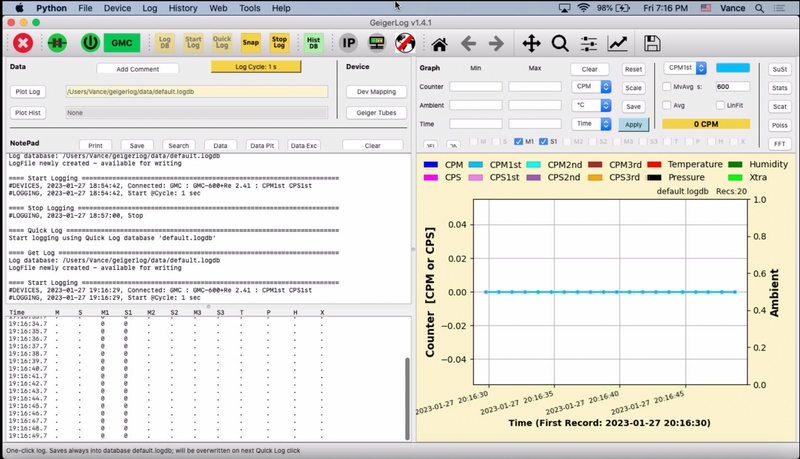
quote:
Originally posted by ullix
Hi Vance,
I need info on what your problem actually is.
Please, follow the steps outlined in the GeigerLog manual, chapter "Problems, Bugs, and Bug Reports".
|
| ihab17 |
Posted - 12/20/2022 : 08:35:35
Folks, please read Reply #19 on this thread, for Windows users it solves all the "installation and configuration" problems. In fact, today I downloaded everything on a new fresh PC and it is working like a charm. Just spend some time reading the manual and for Windows users, please read Reply #19 |
| ullix |
Posted - 12/13/2022 : 00:59:08
@careli: Sorry, but you are complaining at the wrong site!
This topic is about my GeigerLog, which is Open Source software. Download for free, use for free, give it to others, also for free and fully legal. No registration, no serial number. You can show it to as many people as you like, and encourage them to also use this software.
And better than paid-for software! Just try it out!
You find GeigerLog here:
https://sourceforge.net/projects/geigerlog/
|
| careli |
Posted - 12/12/2022 : 08:44:47
I cannot register my software! I have my SN but there remains "UNREGISTERED DEMO ONLY" in the background.
As I have to use the device in public lectures, I cannot afford to show this to so many people.
Please give me a hint.
Prof. Carlo T. Schmartz |
| ullix |
Posted - 12/01/2022 : 09:21:50
Thanks, Brad.
And I just want to encourage people to follow up. It is here:
https://sourceforge.net/p/geigerlog/discussion/features/
|
| KA3YAN |
Posted - 11/30/2022 : 14:24:44
Sorry, those were my shorthand for indentures. So "-" = first bullet and "+" are the sub-bullets under the title "-" bullet. So it could've and probably should've been
1. Saved window geometry
a. window size and location
b. location of splitter (between widgets)
2. Saved graph elements
a. graph color changes
b. saved data points (check/uncheck)
I'll take this over to the new forum as requested.
Brad |
| ullix |
Posted - 11/30/2022 : 01:06:58
@Brad: I welcome the discussion of GeigerLog features, but think that this forum is not the right place. Therefore I opened a new forum on the GeigerLog site called "Feature Request" where such ideas can find their home:
https://sourceforge.net/p/geigerlog/discussion/features/
Looking forward for your input!
Re your requests: it is a lot of work to do this right, and I am not so inclined. Unless there is really supporting requests from more people. But what do the minus signs mean at "Saved ..." ? Remove things?
More discussion please at the SourceForge site.
|
| KA3YAN |
Posted - 11/29/2022 : 08:06:33
ullix,
Not sure if this forum or Source Forge is more appropriate, so I picked this one. I'd like to make a couple of feature requests:
- Saved window geometry
+ window size and location
+ location of splitter (between widgets)
- Saved graph elements
+ graph color changes
+ saved data points (check/uncheck)
I believe these would have to be saved to an external file, so maybe the config or db. Not totally sure.
This application is amazing BTW! It's really fantastic and I'm loving the enhanced functionality over other utilities for the GMC counters.
Thanks for all you do for the community!
Brad |
| Damien68 |
Posted - 11/29/2022 : 07:46:30
quote:
Originally posted by ullix
You better use the original and the translated version side-by-side.
I also think that it is essential to always have the original version in front of you, it is true that the translations are very impressive but it remains an interpretation as long as it has not been validated and supported by the author of the original text.
PS: with chrome you can translate any web page by right clicking on the page and in the contextual menu you find what you need to translate the page. |
| ullix |
Posted - 11/29/2022 : 04:40:01
Oh dear! But what could I possibly do more than putting commands in its own fonts on its own line in such a post? This is laborious enough in this forum.
But speaking about translators: I use the Google translator, and I am usually quite impressed with the result.
One can put the whole GeigerLog manual into the Google machine and it is translated and can be downloaded.
I tested German and read my Calibration chapter: overall very good, though a few hick-ups here and there. Mostly related to formatting, which really can be very annoying when reading a table. This seems mostly an issue with the pdf format itself, which can be a nightmare to handle. Google accepts no documents but pdf.
Then I tested French. I am not good enough in French to judge quality, but I enjoyed "Fenêtres – Installation", and "Framboise Pi – Installation" :-)). Google got this context-stuff right in German.
The commands were mostly maintained (with exceptions: "python3 m pip install user U fichier son"), but the formatting problems really act up!
You better use the original and the translated version side-by-side. But, oh boy, what a progress over only a few years ago.
Her is a link for the translator: https://translate.google.com/?hl=de&sl=auto&tl=de&op=translate
|
| Damien68 |
Posted - 11/29/2022 : 02:33:19
quote:
Originally posted by mimichris
As you corrected the sentence by removing the "en"
the mention "en" was added by the English->French translator of google, I had the same effect:
the sentence "python geigerlog" is translated into "GeigerLog en python" |
| ullix |
Posted - 11/29/2022 : 02:22:18
I am really wondering why I spend so much time carefully writing the manual? It seems time to revive this old saying: RTFM!
And read it THOROUGHLY and follow EXACTLY the steps it is giving!
If then problems arise, contact me again.
|
| mimichris |
Posted - 11/29/2022 : 00:13:56
As you corrected the sentence by removing the "en", I thought it would work, well no, here are the error messages:
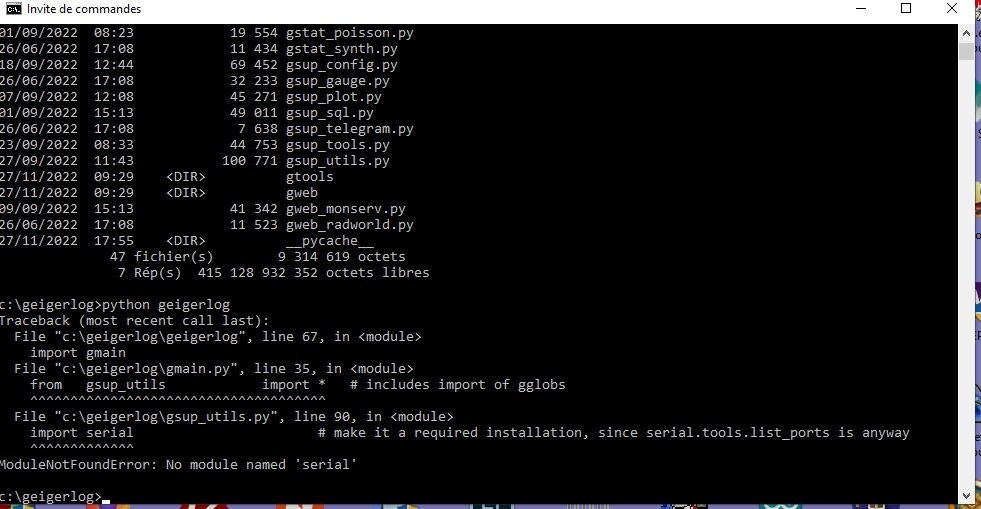 |
| mimichris |
Posted - 11/28/2022 : 07:32:36
Thank you very much for your help, I know Dos since I started with a PC under Dos, what I don't know is how to use Python, the "Geigerlog in python" link does not work, see image below.


|
| ullix |
Posted - 11/28/2022 : 02:58:09
I take it from your posts that you are well versed in the Geiger technology itself, but the computer is giving you a headache? By what you said it looks like you have some rather basic computer deficits; I suggest to consider taking a computer class at a local school or computer club. That is, if you don't mind being around all those youngsters ;-).
There are almost always multiple ways of doing things on a computer. I will give only a single one. You'll soon enough dicover all the others.
First, we need to open a "Terminal" in Windows. Microsoft may name this differently, like "Command Prompt", or only "cmd", or in yet other ways. To open it, press and hold the "Windows key", then press key "R", then release all keys. A dialog pops up, where you enter "cmd" (without quotes), then click Ok.
A completely black window pops up, with some white info text at the top, plus a blinking cursor. This is your terminal. Now type:python -V To execute such a command you will always have to press the "Enter" key following your command - I will not mention this anymore.
The answer should be: "Python 3.8.6" or similar. This tells you that Python is installed, working, and its version is 3.8.6. GeigerLog requires Python 3.7 or later, so this is good enough.
Now change into the GeigerLog working directory. I assume you followed the installation instructions of the GeigerLog manual, then execute in the terminal:cd c:\geigerlog
To verify that this is indeed the working directory of GeigerLog, execute "dir" in the terminal. You should see a whole bunch of filenames flying by, such as these:....
16.681 gdev_wificlient.py
16.449 gdev_wifiserver.py
2.440 geigerlog
... If you don't see them, you are in the wrong directory! Verify where you installed GeigerLog, and change into that directory!
Now, being in the GeigerLog working directory, you start GeigerLog with:
python geigerlog
GeigerLog starts and a dialog box pops up reminding you that You have not activated any devices. It explains how to do this activation. But before you follow this text EXACTLY to activate your GMC counter, do the following:
Click Ok on the dialog box, and from the GeigerLog menu choose:
History --> Get History from Database, and in the upcoming file dialog select flight.hisdb.
This will show real Geiger data from a long distance flight. Experiment with these data as explained in the GeigerLog manual chapter Quick Tour of GeigerLog (page 17 or nearby) to become familiar with GeigerLog.
Enjoy!
|
| mimichris |
Posted - 11/27/2022 : 07:41:57
Thanks,
I have never started a program under Python, and I don't know where Python is installed, I have in the Windows directory:
py.exe
and
pyw.exe
when I put this link in the shortcut, it launches a DOS window which closes immediately and nothing happens .... I have some difficulties, with the age of 81 years ....
the path I put C:\Users\mm706\AppData\Local\Programs\Python\Python311\python.exe c:\geigerlog\geigerlog
It does not work it opens the AppData folder....
|
| ullix |
Posted - 11/27/2022 : 05:44:28
This are the installation instruction from the GeigerLog manual:
quote:
Installation of GeigerLog
It is suggested to place GeigerLog directly under c:\. Unzip the content of geigerlog-vXYZ.zip file to c:\. This will have created the folder c:\geigerlog with the required content.
Start GeigerLog from a Command Prompt window with:
python3 c:\geigerlog\geigerlog
More conveniently, create a shortcut to the file geigerlog in your geigerlog folder and place the shortcut on your desktop. Then open the shortcut’s properties and change its Target to:
python3 c:\geigerlog\geigerlog
Every time you click the shortcut, a Command Prompt window will open and GeigerLog will be started from there. Output from GeigerLog will go into this command window, but in addition always also into the program log file geigerlog.proglog in the data directory of GeigerLog.
If you don’t want this extra Command Prompt window, then edit the shortcut’s Target to:
python3w c:\geigerlog\geigerlog
Note the ‘w’! Remember to replace ‘python3’ with whatever your system requires; the ‘python3w’ might be a simple ‘pythonw’!
Which is the part unclear to you?
Have you started any other Python program before? Is it the 'command prompt' which bothers you?
|
| mimichris |
Posted - 11/27/2022 : 00:37:06
Hello,
I don't understand how to launch Geigerlog with Python under Windows 10, what is the command line? I installed the latest version of Python but don't know how to do it. Please help me. |
| ullix |
Posted - 11/22/2022 : 00:50:45
Hi Vance,
I need info on what your problem actually is.
Please, follow the steps outlined in the GeigerLog manual, chapter "Problems, Bugs, and Bug Reports". |
| vyzbick |
Posted - 11/21/2022 : 12:54:53
Hi, I am using a Macbook Pro M1 Pro running Monterey 12.6.1 and tried installing Python and all the additional elements in the instructions but still could not get the app to open. There were issues of missing pieces that I could not get resolved. Please help! Thanks :)
quote:
Originally posted by ullix
A major overhaul behind the scenes, but the user of just a GMC counter will barely notice the difference. The last stop before the 1.0 release.
The Windows installation, though, has gotten much, much simpler with the support of the very latest Python and graphic toolkit; details in the manual.
All available for download at the GeigerLog site at SourceForge: https://sourceforge.net/projects/geigerlog/
Image Insert:

175426 bytes
GeigerLog now supports multiple new devices, including I2C based sensors, more IoT devices, LabJack.
Of particular interest to Geiger aficionados will be the new support for audio-click signals from counters to collect CPS and CPM data, making classic counters, low cost counters, as well as the latest semiconductor counters available for handling and recording with GeigerLog. And all devices can be connected at the same time.
As the GMC counters offer both a digital output, as well as an audio-click output, they are a nice target to validate the AudioCounter performance of GeigerLog. Here an example for a GMC-300E+ counter, blue is digital connection, red is audio connection. No difference:
Image Insert:

115136 bytes
More thorough presentation and discussion in this article: GeigerLog-AudioCounter-Support https://sourceforge.net/projects/geigerlog/files/Articles/GeigerLog-AudioCounter-Support-v2.0.pdf/download
!!!!!!!!!!!!!!!!!!!!!!!!!!!!!!!!!!!!!!!!!!!!!!!!!!!!!!!!!!!!!!!!!!!!!!!!!!!!!!!!!
Finally the GeigerLog Version 1.0 has just been released. See at the usual place:
https://sourceforge.net/projects/geigerlog/
|
| ullix |
Posted - 10/10/2022 : 23:36:42
"index.php" - Ooops, this helpful little info was lost in action. Will be in the next release of the GeigerLog manual. Thanks for pointing it out.
|
| Michel2017 |
Posted - 10/10/2022 : 07:14:59
Thanks for the update! It works!
A small suggestion for the manual (which by the way is also excellent --- a very informative reading):
With the instructions on page 87, I was able to set up my GMC 500+ as a WiFi Client Device --- All is working fine and the values are received by GeigerLog.
However, it took me quite a while to figure out that the php scrip at step 3 should have the file name "index.php". Maybe some future version of the manual could indicate the file name for the php script.
Thanks,
Michel |
| ullix |
Posted - 10/10/2022 : 00:11:57
Yes, it is a bug; thanks for reporting.
Looks like I forgot that the minute has 60 seconds! :-(
Get the right value by dividing by 60. I'll work out a fix.
==================================================================
UPDATE: the fix was easy enough.
I have released GeigerLog in a new version 1.4.1. Download from: https://sourceforge.net/projects/geigerlog/files/
Again, thanks for a clear report.
|
| Michel2017 |
Posted - 10/08/2022 : 06:53:19
Thanks ullix for this excellent software!
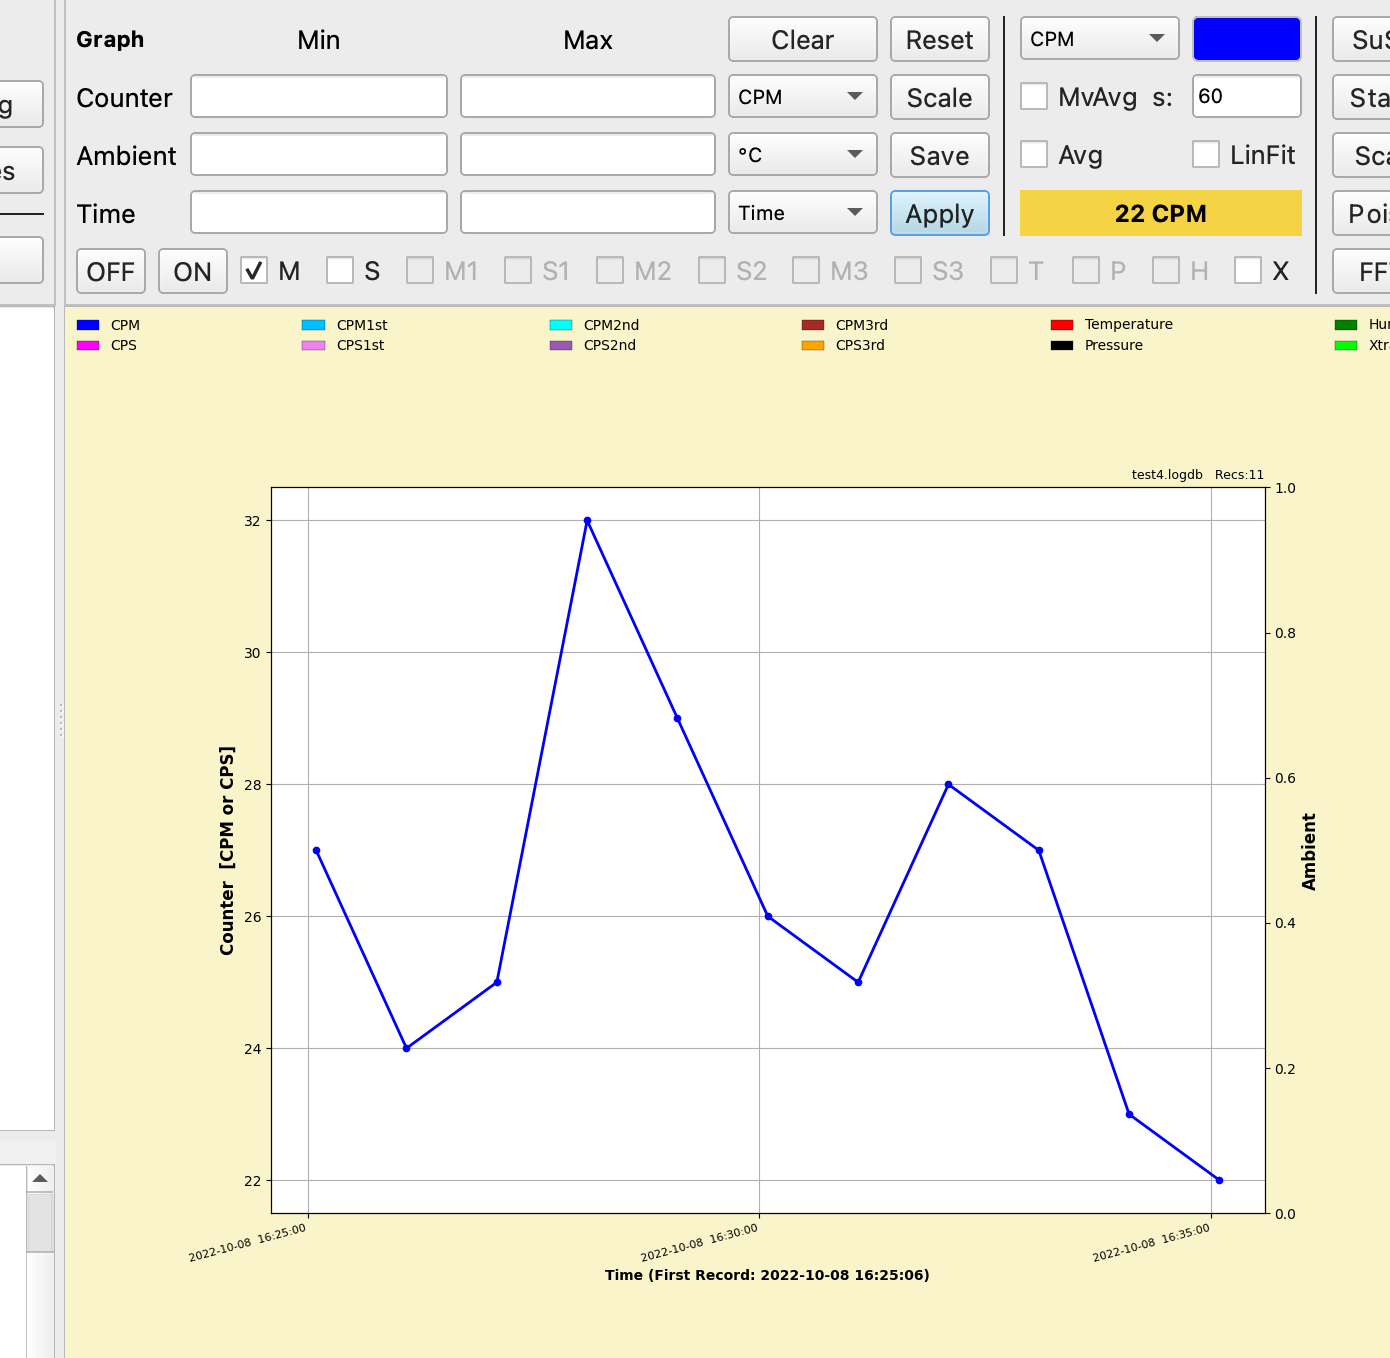
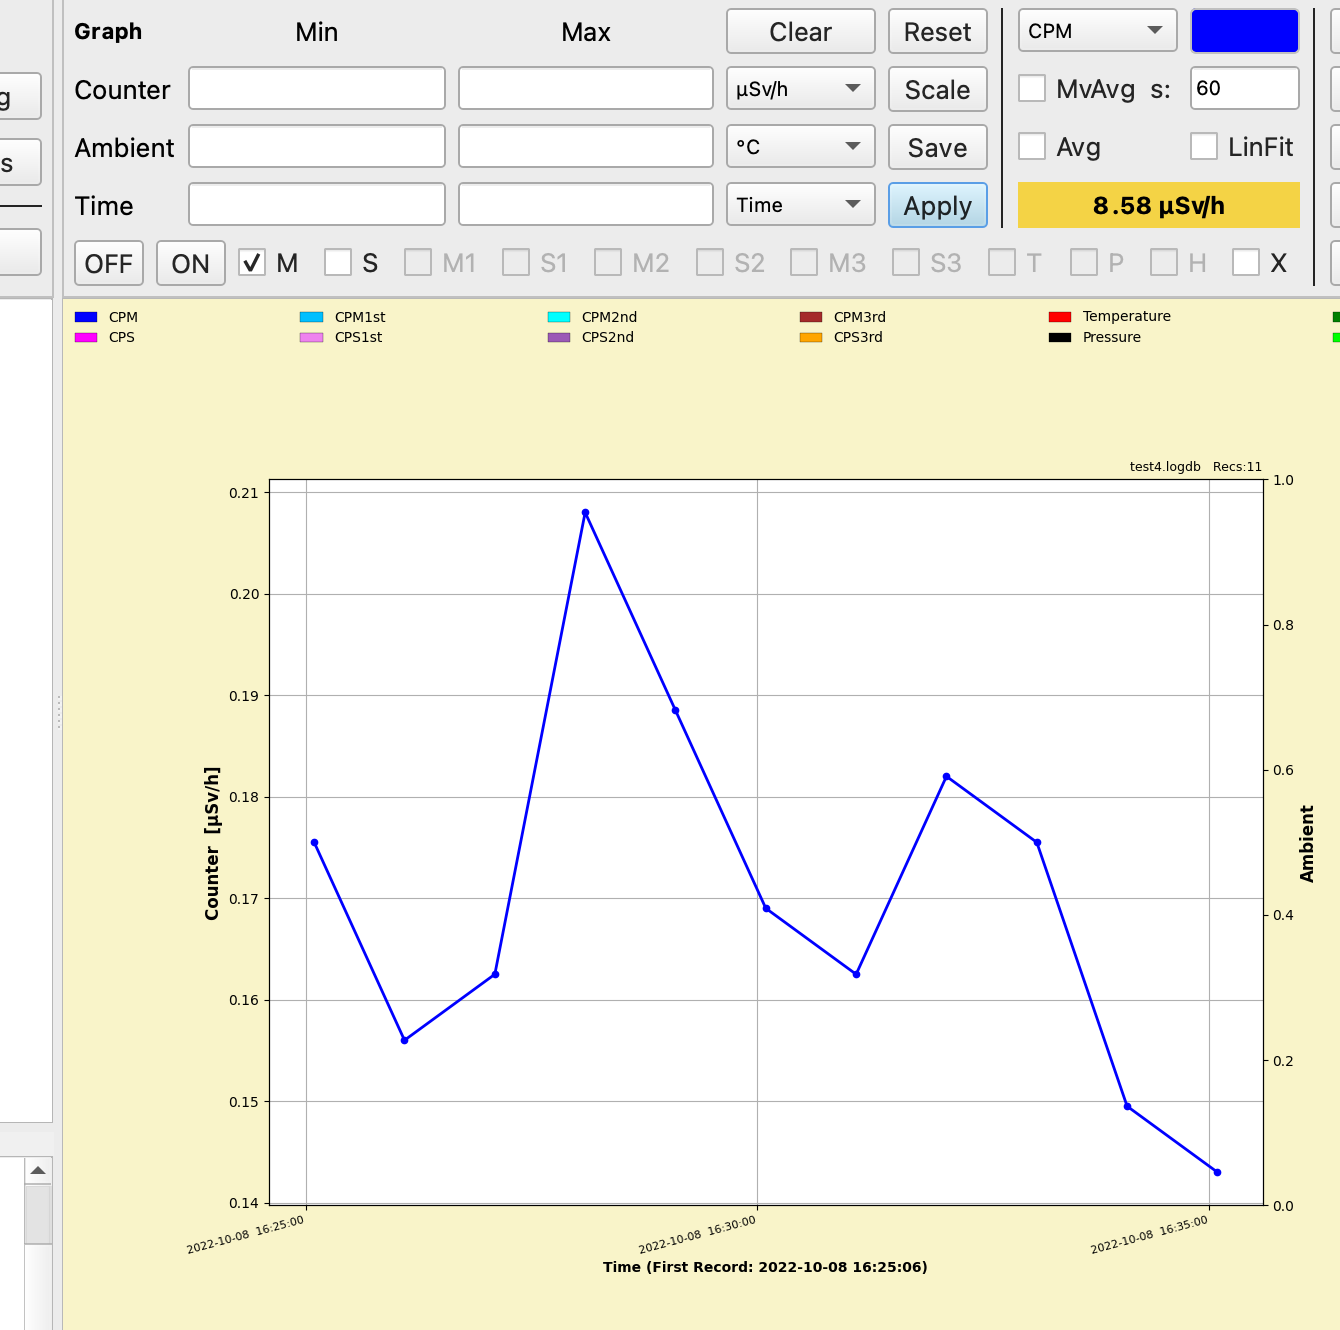
I'm using it on a Mac with Python 3.10.2 --- All is working fine. However, already since the previous version, I observe a strange phenomenon with the "last value box". Below is an example:
The last Value is 22 CPM and the Figure displays the last value correctly.
When I then change to uSv/h, the Figure shows the correct value of ~0.142 uSv/h, but the "last value box" shows it as 8.58 uSv/h....I'm using the default tube sensitivities, no change. The Figure shows it correctly, but the value in the box is wrong...Has anyone else the same issue..? Any idea what the reason for this problem could be?
Thanks,
Michel
|
| ullix |
Posted - 10/02/2022 : 03:22:13
I have just released GeigerLog Version 1.4.0 !
Download at the usual site: https://sourceforge.net/projects/geigerlog/
What is new:

I think the various incarnations of a Raspi Computer will get an increasingly important in their cooperation with GeigerLog!
Otherwise, I think it is simpler, cleaner, faster. Enjoy!
|
| ullix |
Posted - 05/14/2022 : 04:01:28
For anyone interested in integrating GeigerLog's WiFi transmissable widgets into other software, there is a pre-release offering available:
https://sourceforge.net/projects/geigerlog/files/Miscellaneous/
While not yet fully tested, a feedback on bugs, issues, suggestions is much appreciated.
Widgets are e.g. each one out of this selection:
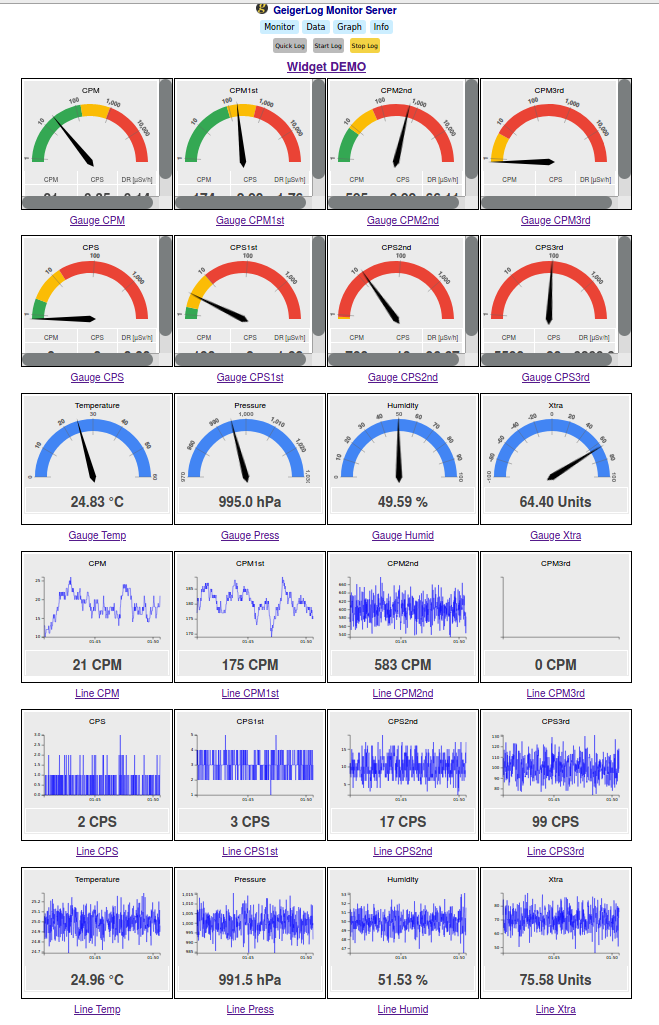
|
| ihab17 |
Posted - 05/08/2022 : 01:29:46
quote:
Originally posted by ullix
GeigerLog has been awarded the SourceForge "Community Choice" for reaching the milestone of 10.000 downloads!
Given this niche application, this is a nice achievement! Thanks for your support.
Appreciate your work, patience, and dedication. All my respect mate, congratulations |
| StevenL |
Posted - 04/24/2022 : 15:23:22
quote:
Originally posted by ullix
Steven, sorry for the confusion. You have seen this right. Files under testing are for special purposes/users, and not for general use. Unfortunately, Sourceforge does not allow me to hide any files from general access. I have now deleted those files.
The latest files are always on this main page: https://sourceforge.net/projects/geigerlog/files/
Latest version is in "geigerlog-v1.3.0.zip".
Ullix, I am making headway now on getting geigerlog operational. Impressive software.
Steven Lightfoot |
| StevenL |
Posted - 04/18/2022 : 05:00:45
quote:
Originally posted by ullix
Steven, sorry for the confusion. You have seen this right. Files under testing are for special purposes/users, and not for general use. Unfortunately, Sourceforge does not allow me to hide any files from general access. I have now deleted those files.
The latest files are always on this main page: https://sourceforge.net/projects/geigerlog/files/
Latest version is in "geigerlog-v1.3.0.zip".
Perfect thx.Im making headway on getting the Python interpreter installed. OnceI am operating, I may have more questions, but I will read the manualfirst. The amount of info you have provided generally is overwhelming (in a good way) and although I have all the right background to understand your work, its not something I do on a regular basis, so its taking me time. Love this stuff. Thanks again. Steven Lightfoot |
| ullix |
Posted - 04/17/2022 : 22:18:18
Steven, sorry for the confusion. You have seen this right. Files under testing are for special purposes/users, and not for general use. Unfortunately, Sourceforge does not allow me to hide any files from general access. I have now deleted those files.
The latest files are always on this main page: https://sourceforge.net/projects/geigerlog/files/
Latest version is in "geigerlog-v1.3.0.zip". |
| StevenL |
Posted - 04/17/2022 : 15:49:47
quote:
Originally posted by ullix
Using Raspi as a GeigerLog WiFiServer Device Version 2.0
I have already reported on the WiFiEnabling of a GMC-300 counter (with no native WiFi) with the version 1.0 (http://www.gqelectronicsllc.com/forum/topic.asp?TOPIC_ID=9836)
But this version 2.0 is a major update to this previous version, establishing a prominent role for the Raspi as a data hub. So I think.
This version not only supports the GMC counter (slightly updated), but now also the use of I2C devices (shown with an LM75B sensor), and the use of pulse counting via Raspi Hardware Interrupt, done with the CAJOE counter as Demo. Took some fiddling with the hardware, but ...
All works well!
Download from the Raspi section https://sourceforge.net/projects/geigerlog/files/Raspi/
Hey Ullix, I am now trying to get Geigerlog going. I have read the manual and install section, this should be doable.
Iam however slightly confused. When I went to SourceForge, in the highlighted green download box (that my eye was drawn to saying DOWNLOAD LATEST VWRSION) the version it implies I should download has Testing written all over it.
As I studied the manual, it seemed clear the version I need to download is actually called 'Geigerlog-v1.3.0.zip' and it it located downthe list of options to download.
Can you clarify which one I need? I assume not its NOT the one implied as being the'latest version' but the one with the correct title.
Thanks a lot.
Steven Lightfoot
|
| ullix |
Posted - 03/29/2022 : 07:00:25
Using Raspi as a GeigerLog WiFiServer Device Version 2.0
I have already reported on the WiFiEnabling of a GMC-300 counter (with no native WiFi) with the version 1.0 (http://www.gqelectronicsllc.com/forum/topic.asp?TOPIC_ID=9836)
But this version 2.0 is a major update to this previous version, establishing a prominent role for the Raspi as a data hub. So I think.
This version not only supports the GMC counter (slightly updated), but now also the use of I2C devices (shown with an LM75B sensor), and the use of pulse counting via Raspi Hardware Interrupt, done with the CAJOE counter as Demo. Took some fiddling with the hardware, but ...
All works well!
Download from the Raspi section https://sourceforge.net/projects/geigerlog/files/Raspi/ |
| ullix |
Posted - 03/15/2022 : 00:21:38
GeigerLog on Raspberry Pi
The Raspi has received a major update of its operating system, now called Bullseye. I updated my Raspi with the 64 bit version and installed GeigerLog. First impression shows notable improvements.
I will provide some code and instructions specific for Raspi, which will all be held in this place: https://sourceforge.net/projects/geigerlog/files/Raspi/
The installation of GeigerLog on Raspi has become easier, though it is not yet fully the Linux standard. I have therefore updated my installation instructions in the manual specifically for Raspi, and I am posting this chapter for download as UPDATE Raspi Installation for GeigerLog-v1.3.pdf.
Unfortunately there is a regression in the Raspi font handling, which for GeigerLog results in a disorganized printout to the NotePad and other places. A workaround is provided with the FONTFIX Raspi GeigerLog 1.3. Just download, unzip and copy file ggeiger.py over the existing file.
Feedback to GeigerLog on Raspi is much appreciated!
|
| Hannes |
Posted - 03/03/2022 : 10:41:54
quote:
Originally posted by ullix
quote:
Did I do something wrong?
Apparently so. The first line of the geigerlog.cfg file, to which the error message refers, has become distorted. It has to look like this:
## geigerlog.cfg - The GeigerLog configuration file
However, before you try to correct anything:
If you can rule out that you yourself were the cause of this distortion, did you by any chance use Windows' Notepad or Wordpad program for the edits?
Microsoft's programs often have the undesirable "feature" to insist on changing all line endings to "Windows Style". The programs mentioned are notorious for this.
Never, ever use Notepad or Wordpad for editing any software files!
Instead, as an editor use "Notepad++", or, my preference, use "Geany". Both are well behaved, open source, non-Microsoft programs.
Don't try to correct the existing, ruined config file; download a new one, and work on this.
Thank you! Now it's all working.
|
| EmfDev |
Posted - 03/02/2022 : 10:36:49
Congrats @ullix! Thank you for your software :) |
| ullix |
Posted - 03/02/2022 : 01:19:45
GeigerLog has been awarded the SourceForge "Community Choice" for reaching the milestone of 10.000 downloads!
Given this niche application, this is a nice achievement! Thanks for your support.

|
| ullix |
Posted - 02/27/2022 : 04:54:22
quote:
Did I do something wrong?
Apparently so. The first line of the geigerlog.cfg file, to which the error message refers, has become distorted. It has to look like this:
## geigerlog.cfg - The GeigerLog configuration file
However, before you try to correct anything:
If you can rule out that you yourself were the cause of this distortion, did you by any chance use Windows' Notepad or Wordpad program for the edits?
Microsoft's programs often have the undesirable "feature" to insist on changing all line endings to "Windows Style". The programs mentioned are notorious for this.
Never, ever use Notepad or Wordpad for editing any software files!
Instead, as an editor use "Notepad++", or, my preference, use "Geany". Both are well behaved, open source, non-Microsoft programs.
Don't try to correct the existing, ruined config file; download a new one, and work on this.
|
| Hannes |
Posted - 02/27/2022 : 03:23:51
Hello,
I have a problem again. I just changed GMC_Activation from no to yes in the geigerlog.cfg file and now I get this error:
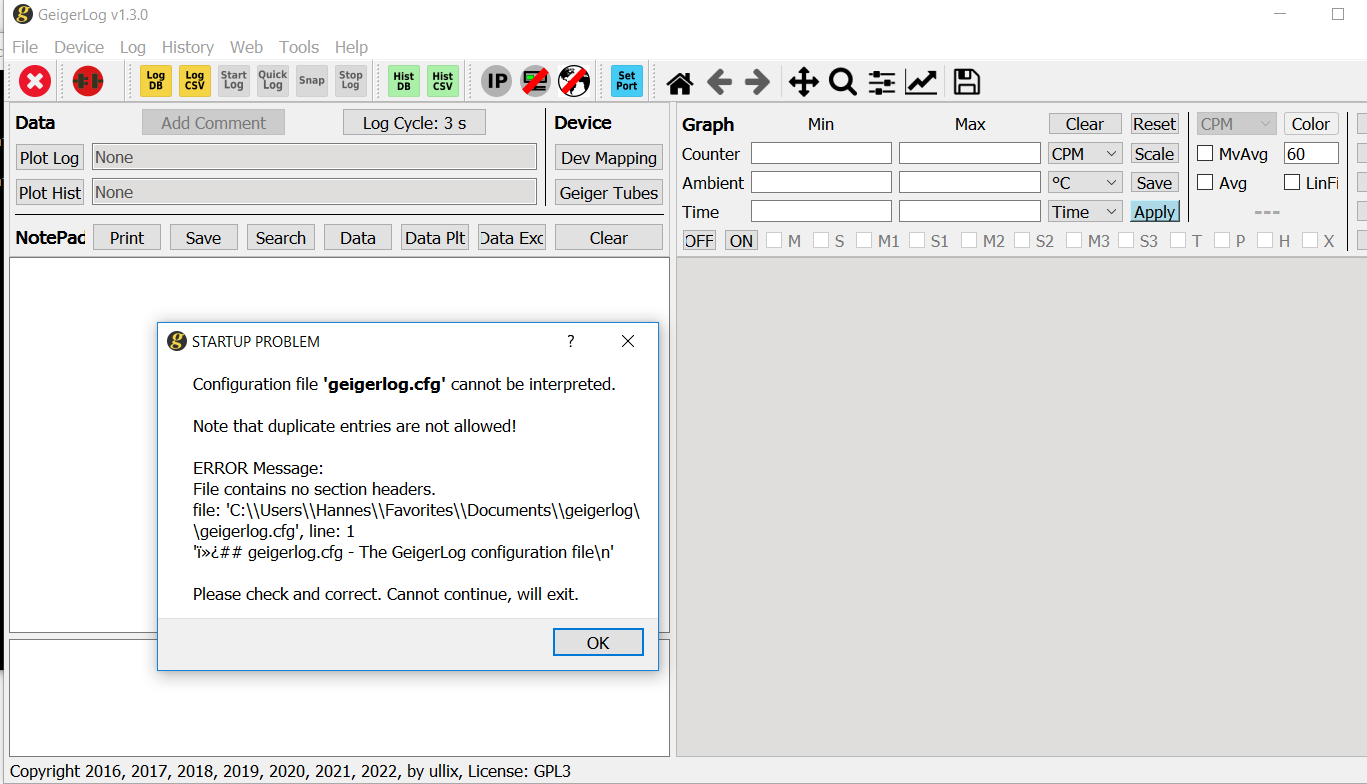
Did I do something wrong?
Greetings,
Hannes |
| ullix |
Posted - 02/26/2022 : 09:28:47
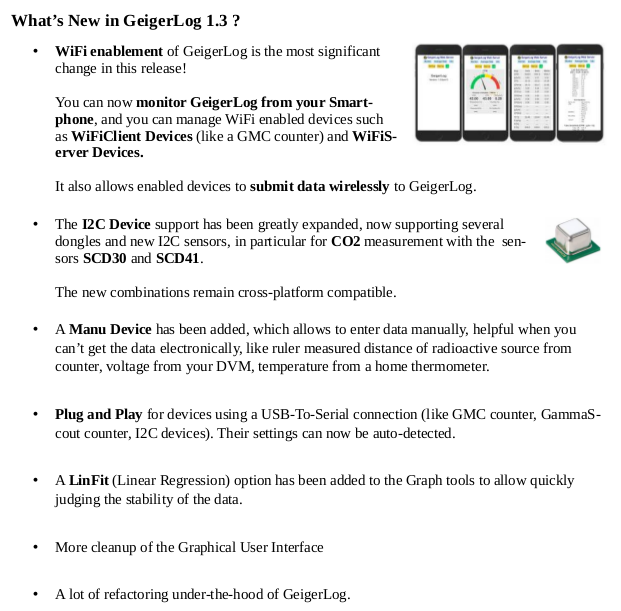
GeigerLog Version 1.3.0 has just been released! Download at the usual site: https://sourceforge.net/projects/geigerlog/
I see the WiFi enablement as a key feature. Today you can do a bit of monitoring using your Smartphone, but nothings stands against controlling GeigerLog completely by Smartphone (except for a lot of work).
The CO2 sensor SCD41 would easily fit into the case of today's 500 counters. To be marketed with an eye on "healthy home environment". Price is ~2x one M4011 tube.
|
|
|

