| T O P I C R E V I E W |
| ullix |
Posted - 05/12/2023 : 04:53:41
A GeigerLog user has kindly provided me with a set of data recorded in connection with an Iodine-131 treatment of a cancer patient.
First, the count rates are very high, and are likely to initially overwhelm the counter! Second, with a half-life of I-131 of about 8 days, the decay is easily visible in recordings which last longer than a day.
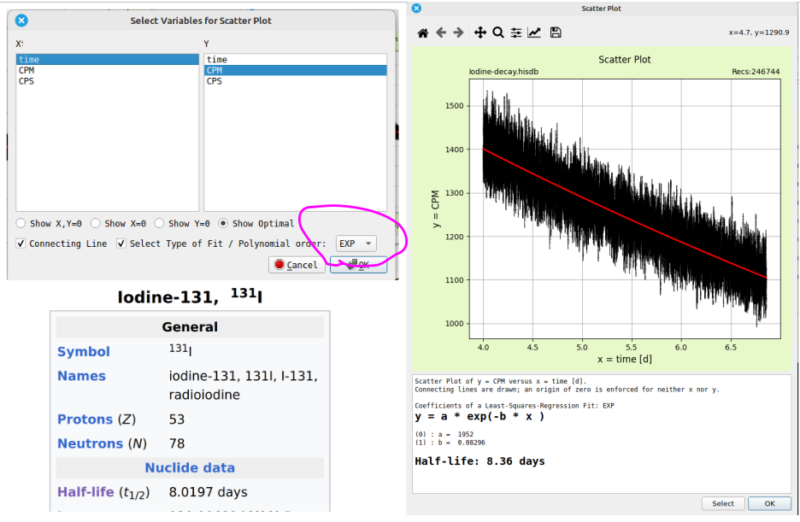
GeigerLog has the feature of making Scatter-Plots, including least-square regressions to polynomial curves. I have now added the ability to make regressions also to exponential, like relevant for radioactive decay, so you can derive the half-life from your data very easily.
Click the "Scat" button and select time for X and CPM for Y, then select "EXP" for type (bottom-right), and click Ok. The data, fit, and half-life are displayed, as the pic shows.
A half-life of 8.36 days is calculated, versus the true HL of 8.02 days.
This is possible only with the latest pre-release #36 of GeigerLog, which you can download here:
https://sourceforge.net/p/geigerlog/discussion/general/thread/beafedc7b1/?page=4#e2e8
The releases change frequently; look for any later one.
|
| 2 L A T E S T R E P L I E S (Newest First) |
| Bobakman |
Posted - 05/14/2023 : 05:15:26
Very Cool feature indeed. Your work in not only devloping GeigerLog but your continuous improvements and additions to it are quite amazing, thank you.
Bob |
| ihab17 |
Posted - 05/14/2023 : 04:41:17
Thanks Ullix, very helpful |
|
|