| Author |
 Topic Topic  |
|
|
ullix
    
Germany
1241 Posts |
 Posted - 08/13/2019 : 08:10:51 Posted - 08/13/2019 : 08:10:51


|
I am sure you have heard about the suspected explosion of a nuclear missile in Russia (if not, google with my subject line).
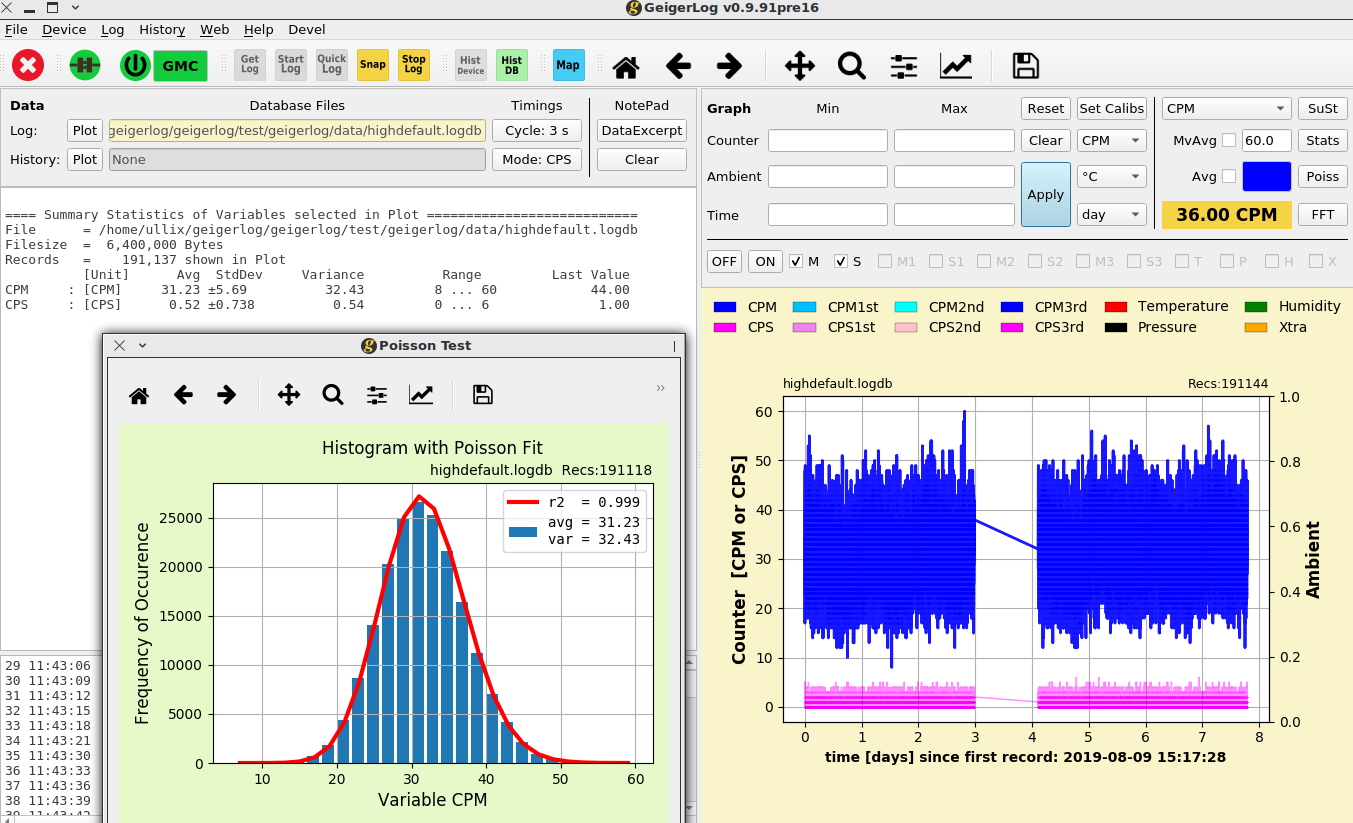
Well, I had shrugged my shoulders, but since the last few days I am seeing in northern Germany a background of some 30 CPM (GeigerLog days: 30.68+-5.64 over now 3 days), while my normal background has never exceeded 20 over the course of now several years.
I am still not convinced that this is of Russian origin; there are many opportunities for some failures. And while 30 vs 20 is a "high" value, yet the difference is beyond simple statistical Error. It is clearly higher than it should be.
I am wondering if anyone else is observing similar increased count rates?
|
|
| Reply #1
EmfDev
    
2391 Posts |
 Posted - 08/13/2019 : 09:20:38 Posted - 08/13/2019 : 09:20:38


|
| That could be true..it might get lower in few days though. |
 |
|
| Reply #2
Geo-Johnny
    
Austria
161 Posts |
 Posted - 08/13/2019 : 09:34:32 Posted - 08/13/2019 : 09:34:32


|
| I think that the increased background radiation from the Meteor showers (Perseids) goes out, which occur more especially in August and September. It is possible that on the northern side of the poles the cosmic radiation penetrates the atmosphere more strongly. But I'm not a scientist, so it's just a personal guess. |
Geiger Counters: GMC320+V5 & GMC500+
Geiger Tubes: M4011; SI-3BG; SBT-9; LND712; SBM-20 |
Edited by - Geo-Johnny on 08/13/2019 09:35:50 |
 |
|
| Reply #3
the_mike
   
Switzerland
53 Posts |
 Posted - 08/14/2019 : 09:29:01 Posted - 08/14/2019 : 09:29:01


|
I confirm Ullix' sightings, after he mentioned his higher readings, i placed my two counter:
GMC500: windproofen place, from normal avr 21 now at about 30 (plus peaks).
The interesting part though was the GMC320 (well - until a thunderstorm/lightning-stroke in the closer area seems to have EMPed my 320...). Placed it "in the wind"; while that one showed normal background-radiation, every gust pushed the CPM from normal 15 CPM up to 25CPM (and some pikes)... Short before the "big bang" it started to rain, and the spikes went up....
Sure - it's not much of an increase, but there was defenetly something active around...
(area: lake constance, middle europe) |
Edited by - the_mike on 08/14/2019 09:29:49 |
 |
|
| Reply #4
EmfDev
    
2391 Posts |
 Posted - 08/14/2019 : 09:59:11 Posted - 08/14/2019 : 09:59:11


|
| Could there be higher background closer to the source? |
 |
|
| Reply #5
paul
   
United Kingdom
54 Posts |
 Posted - 08/14/2019 : 14:04:28 Posted - 08/14/2019 : 14:04:28


|
Thank You ullix and the_mike
please keep us informed
my device is in storage ,but I will try to dig it out tomorrow.
this is why I bought it.
|
Edited by - paul on 08/14/2019 14:07:03 |
 |
|
| Reply #6
Stargazer 40
    
USA
431 Posts |
 Posted - 08/14/2019 : 18:21:36 Posted - 08/14/2019 : 18:21:36


|
Are we seeing any wave of data increase on the GMC World Map? I don't see anything in northern Germany. One 48. Not sure how many of you contribute there but certainly would be helpful to see trends.
|
Stargazer 40 |
 |
|
| Reply #7
paul
   
United Kingdom
54 Posts |
 Posted - 08/15/2019 : 12:15:06 Posted - 08/15/2019 : 12:15:06


|
I've been watching since the "incident" ,but there has not been any
dramatic changes.
Here in Scotland my readings are normal. |
 |
|
| Reply #8
ullix
    
Germany
1241 Posts |
 Posted - 08/17/2019 : 00:22:08 Posted - 08/17/2019 : 00:22:08


|
It is now over a week of unusually high counts. As the GeigerLog graph shows, the data are perfectly stable judged by the time course, and, more relevant, by the very clear Poissonian nature of the data.
Image Insert:
210345 bytes
Compare this with all my data published in my various Articles on the GeigerLog site https://sourceforge.net/projects/geigerlog/files/Articles/ and it is clear this is higher than usual.
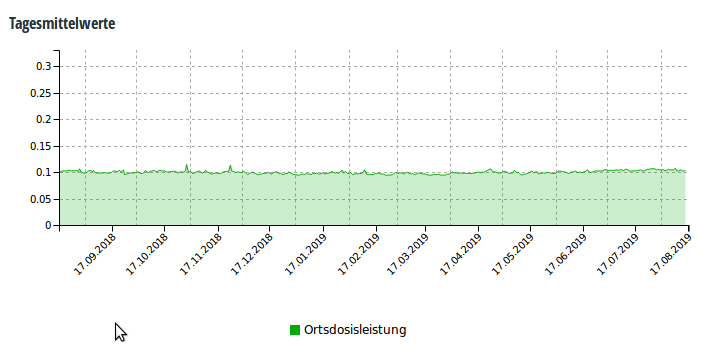
Yet, looking at official data from a nearby station https://odlinfo.bfs.de/DE/aktuelles/messstelle/051220002.html shown in the next graph, there is not even a hint on some elevated levels since the last week(s).
Image Insert:
15948 bytes
I remain puzzled.
Has it been observed that a counter, in particular a GMC counter, increases its Bull count over the time?
|
 |
|
| Reply #9
Stargazer 40
    
USA
431 Posts |
 Posted - 08/17/2019 : 01:43:34 Posted - 08/17/2019 : 01:43:34


|
ullix, what's a Bull count?
If you are suggesting that the tube is aging or the electronics are aging, I would think that there is always for all electronic equipment a degree of burn in and then subtle alteration of the components due to some amount of heat generation while running over maybe years of use. I look at your graphs and see the stable and very nice Poisson fit and would say your data is highly reliable. I find it strange that you noticed this only after an event and are looking at causality. What about the period before the event? I take it you don't have data that would show some kind of ramp up?
You likely know more about what your graphs are telling you than any of us, but without more data I'm thinking you have little reason to blame the meter unless someone (and really who besides you goes to the lengths you go to capture and analyze) has seen a consistent rise over time in other places and no event to possibly provide cause.
You encourage me to use GeigerLog one day, but time it seems is always fleeting. |
Stargazer 40 |
Edited by - Stargazer 40 on 08/17/2019 01:44:32 |
 |
|
| Reply #10
Stargazer 40
    
USA
431 Posts |
 Posted - 08/17/2019 : 05:07:35 Posted - 08/17/2019 : 05:07:35


|
| Oh, and are you placing the meter anywhere different or exactly in the same spot as always before? Thinking somehow less shielding now so counts up a bit. |
Stargazer 40 |
 |
|
| Reply #11
ullix
    
Germany
1241 Posts |
 Posted - 08/19/2019 : 00:42:58 Posted - 08/19/2019 : 00:42:58


|
quote:
Originally posted by Stargazer 40
ullix, what's a Bull count?
Gosh, how would I know. Make this the Null count ;-), the count when only background should be observable.
The idea was that the background generated by the instrument itself, having nothing to do with radioactivity, is increasing over time. Any indications for such an observation? My instrument is screwed shut, so no accidental touching of the voltage settings.
I have also re-positioned the instrument for as much as the cable would permit, but no change whatsoever in the count rate.
|
 |
|
| Reply #12
Stargazer 40
    
USA
431 Posts |
 Posted - 08/20/2019 : 05:09:42 Posted - 08/20/2019 : 05:09:42


|
| Null count. Thanks. I don't do much background recording. All my interest is in first responder incident measures. I would suggest that if it stays 'higher' than previous that you ratchet up the baseline and you'll be the test case for if the aging actually is occurring. However if it goes back down then perhaps it's real. Perhaps someone in Japan or US west coast could chime in on the Japanese reactor background increase and settling down of that. |
Stargazer 40 |
 |
|
| Reply #13
Damien68
    
France
780 Posts |
 Posted - 08/23/2019 : 12:20:14 Posted - 08/23/2019 : 12:20:14


|
The device itself is only a counter that counts or does not count, there is no aging itself.
After the tube can age and lose its sensitivity, but with low radiation, I think there is not too much risk of degradation for 10 years for example.
Someone did you test by placing a meter in a lead box? |
Mastery is acquired by studying, with it everything becomes simple |
 |
|
| Reply #14
ullix
    
Germany
1241 Posts |
 Posted - 08/24/2019 : 00:08:42 Posted - 08/24/2019 : 00:08:42


|
Well, well, what have we got here:
Image Insert:
98049 bytes
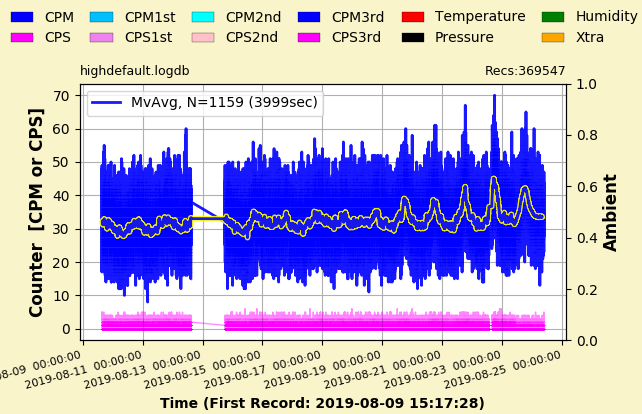
This is the "missile explosion" recording running now for over 2 weeks in GeigerLog, showing an unexpected high background level of over 30CPM versus the expected under 20 CPM. But at least in the second half, it is anything but a clean background. It clearly shows a cyclic pattern, showing peaks every day around 7PM. This is particularly obvious when looking at the Moving average curve, the yellow framed curve in the middle of all the blue. WTF?
Initially I had the counter on a shelf, near the wall, which might give some contribution to the background, though I had not seen it before. So I then repositioned the counter to about the middle of my desk, more than 1m away from the wall (no effect on the counts, as far as I could tell). This relocation occurred near the middle of the graph (exact: 2019-08-17 16:43:18).
Coincidentally, a high-pressure system settled over Germany, which means sunshine, and increasing sunshine for the following days. The window of my study is facing due West, and in the late afternoon, with a maximum at this time of the year near 7pm, I get sunshine on my desk, and it becomes a lot warmer in my study. And so the counter also gets a lot more sunshine, and it becomes warmer!
Hasn't there been someone reporting on light-sensitivity of the counters? Oh, this was I myself : http://www.gqelectronicsllc.com/forum/topic.asp?TOPIC_ID=4540&SearchTerms=light,sensitivity
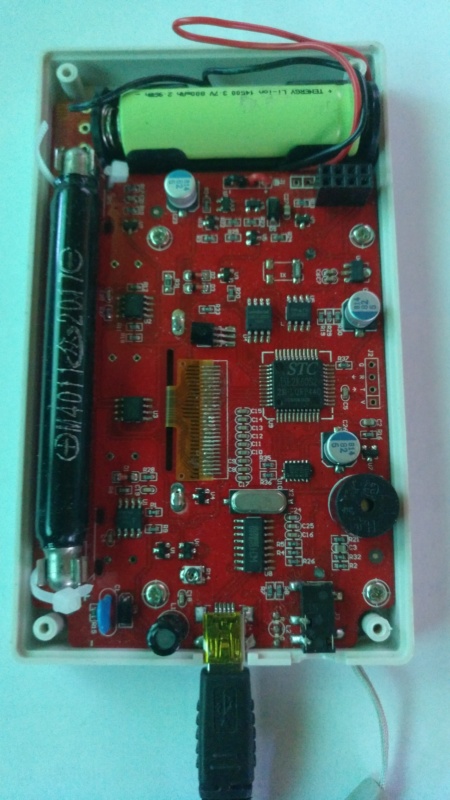
As a consequence, GQ switched to the black-painted version of the glass tube M4011. I got this tube and tested it thoroughly, and it did not exhibit the light sensitivity. But now look at my counter and its M4011 2017 tube: it is a black one! And yet ...
Image Insert:
133090 bytes |
 |
|
| Reply #15
Damien68
    
France
780 Posts |
 Posted - 08/24/2019 : 05:00:43 Posted - 08/24/2019 : 05:00:43


|
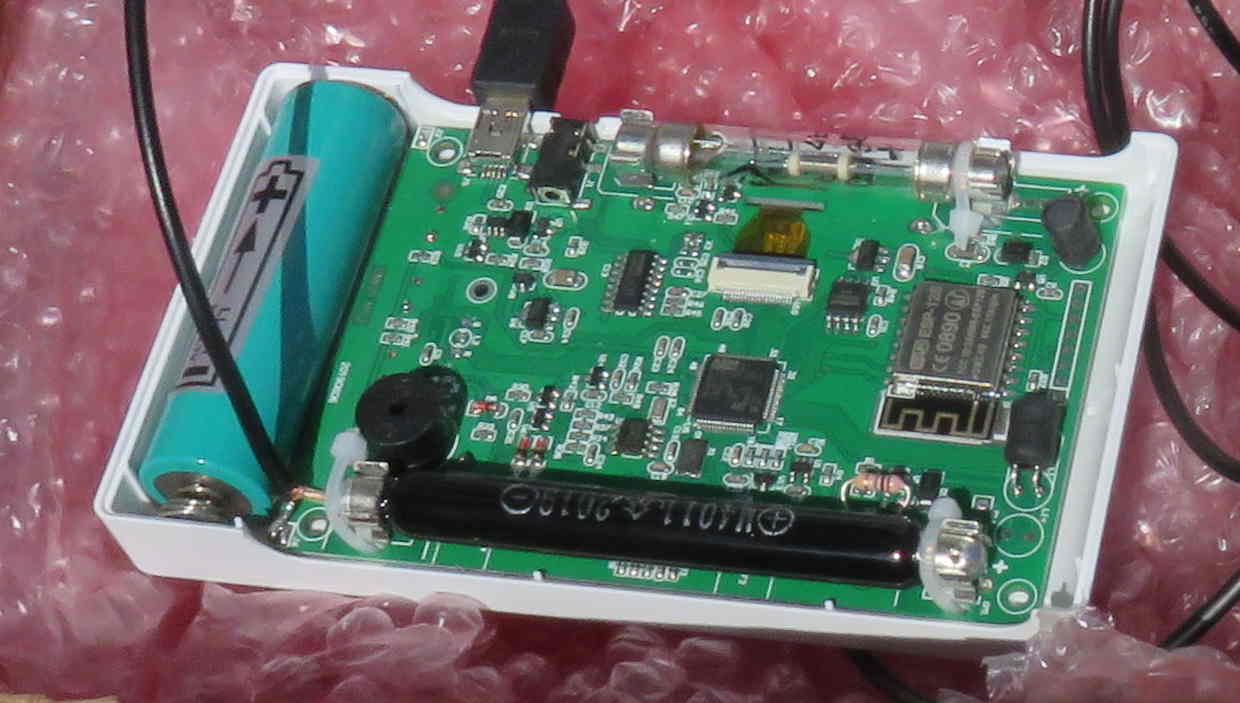
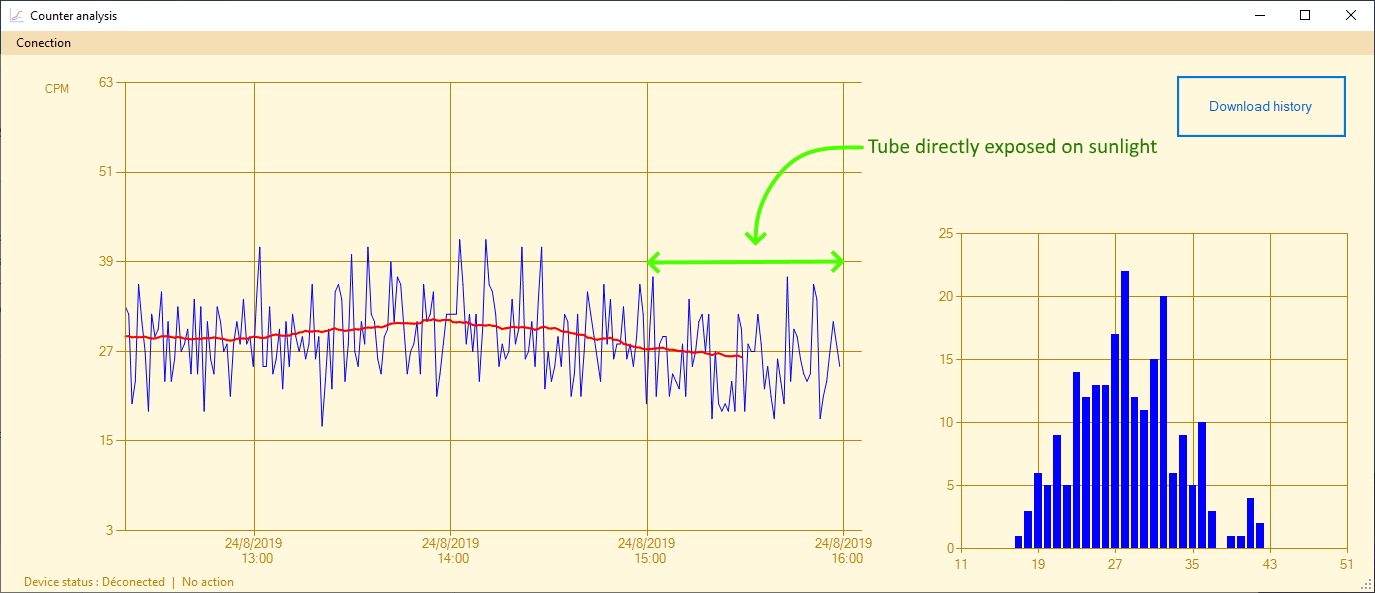
I do experimentation,
I placed my detector opened, its tube directly exposed to the sun's radiation for 1 hour, I had no phenomenon
Image Insert:
76288 bytes
Image Insert:
288079 bytes |
Mastery is acquired by studying, with it everything becomes simple |
Edited by - Damien68 on 08/24/2019 06:10:24 |
 |
|
| Reply #16
ullix
    
Germany
1241 Posts |
 Posted - 08/25/2019 : 06:59:56 Posted - 08/25/2019 : 06:59:56


|
@Damien:
NOT responding to light is the norm among the M4011 tubes, be they they of the blackened or the transparent glass type. So, you have just another tube where the effect is not visible. |
 |
|
| Reply #17
ullix
    
Germany
1241 Posts |
 Posted - 08/26/2019 : 00:23:00 Posted - 08/26/2019 : 00:23:00


|
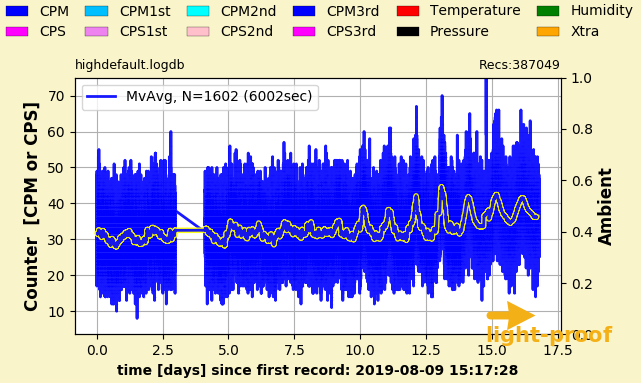
Another 2 days have shown that light-sensitivity of the tube is clearly NOT the problem!
See the yellow arrow in the bottom-right corner of the picture: this marks the last 2 days, with the counter wrapped in two layers of black cloth, and then put in a cardboard box. There is no light reaching the tube/counter, yet there is the same daily pattern of max count rate near ~7pm.
Image Insert:
94523 bytes
As the increased light in the late afternoon goes hand-in-hand with increased temperature, this effect might as well be a heat effect. The peaks do look a bit smoothed-over compared to the previous days, which could be explained with the increased insulation due to the light-proofing, which would dampen any temperature swings.
So, is it all a heat effect? Maybe. Only an experiment will tell.
|
 |
|
| Reply #18
Damien68
    
France
780 Posts |
 Posted - 08/26/2019 : 04:24:06 Posted - 08/26/2019 : 04:24:06


|
what happens at 7 pm?
look around if someone is radioactive? |
Mastery is acquired by studying, with it everything becomes simple |
 |
|
| Reply #19
EmfDev
    
2391 Posts |
 Posted - 08/26/2019 : 09:59:59 Posted - 08/26/2019 : 09:59:59


|
| Hi ullix, thank for the experiment, we will investigate this phenomenon and see what really is that cause. Is 7Pm there quite hotter than other part of the day? |
 |
|
| Reply #20
ullix
    
Germany
1241 Posts |
 Posted - 08/26/2019 : 23:01:37 Posted - 08/26/2019 : 23:01:37


|
@Damien: Please, look at the curves: this is not a point effect, this is an effect over 24 hours. The max is AROUND 7pm; every day! The pattern is clearly 24h cyclical.
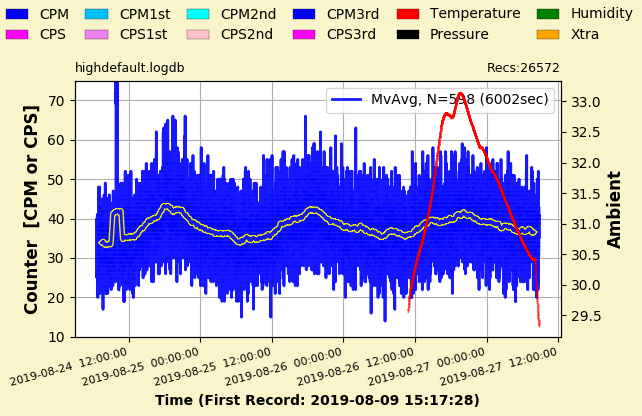
This thing started as just some GeigerLog tests, so I only had the GMC300 connected. I have now also connected my I2C devices to GeigerLog, and I am recording temperature, air pressure, humidity and light around the counter. The counter still being in a light proof enclosure.
The picture shows overnight result fro just counter (blue, with Moving average in yellow framed curve) and temperature (red). The temp swing isn't much; just about 3.5°C. The correlation between temperature and CPMs is undeniable. Though not necessarily proving cause and effect.
Image Insert:
101244 bytes
|
 |
|
| Reply #21
Damien68
    
France
780 Posts |
 Posted - 08/27/2019 : 07:18:34 Posted - 08/27/2019 : 07:18:34


|
Hi Ullix,
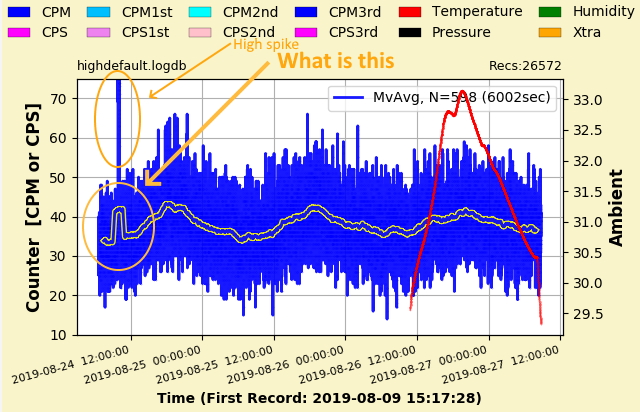
At the beginning of the recording that you show us, there is a phenomenon at around 8 AM (2019-08-24)
a higher average level similar level to those received at 19h but with spicks really higher than 75 CPM
it's strange
Image Insert:
255773 bytes
Another way to see the same thing is to say that your level increases from 7am and drops from 7pm.
I am not too specialized but there may be interferences with for example radon gas that releases alpha particles.
In principle alpha particule is not detectable by your meter but I believe partially detectable anyway.
for example if you cut a ventilation in the morning at 7am and turn it on again at 7pm, this kind of thing can explain what happens.
or maybe you have an alpha source close to the counter, and maybe the temperature of the glass tube changes the alpha sensitivity even if it's nominally very weak.
This could also explain what is happening |
Mastery is acquired by studying, with it everything becomes simple |
Edited by - Damien68 on 08/27/2019 08:20:47 |
 |
|
| Reply #22
ullix
    
Germany
1241 Posts |
 Posted - 08/27/2019 : 23:45:20 Posted - 08/27/2019 : 23:45:20


|
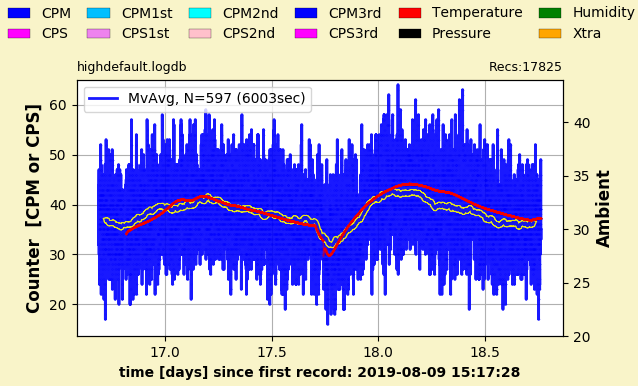
With an additional day of measurements I get this:
Image Insert:
88029 bytes
Blue is CPM, yellow the moving average of CPM, red is temperature. The two curves are overlaid by adjusting scaling (no curve fitting here).
I think this does well establish a temperature effect. But on what: the tube? the counter? or their combination?
|
 |
|
| Reply #23
ullix
    
Germany
1241 Posts |
 Posted - 08/29/2019 : 23:46:05 Posted - 08/29/2019 : 23:46:05


|
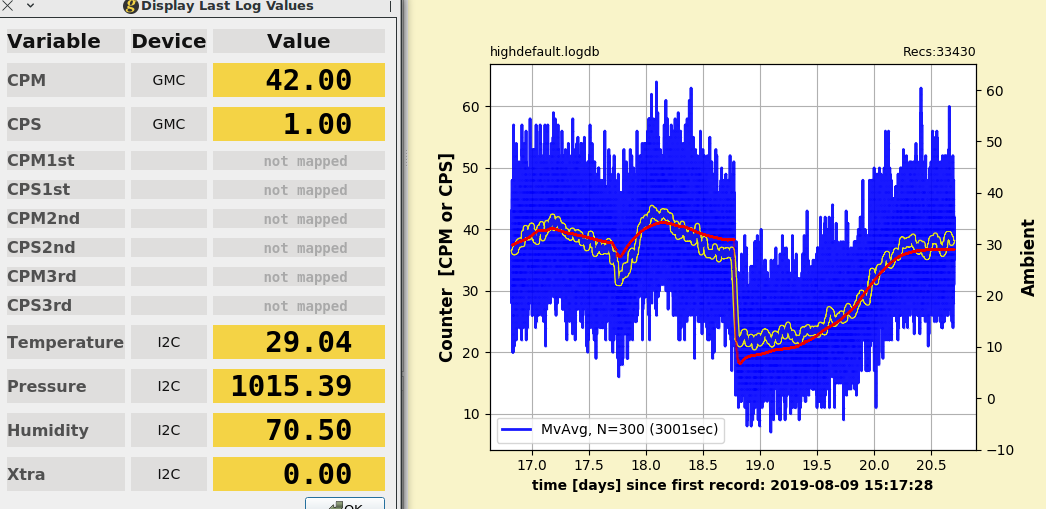
I had put the counter and instruments in a camping-cooler-box and added 6 deep frozen cooling elements (also called reusable ice packs) at about 18.7days in the picture.
The temperature dropped to ~5°C, and then it slowly warmed up to ambient, giving a nice temperature profile.
The inset in the pic shows the very last values of the data. Xtra is light-intensity (it is setup in a light-proof enclosure). Air pressure is still high, and it is warm here.
Image Insert:
143906 bytes
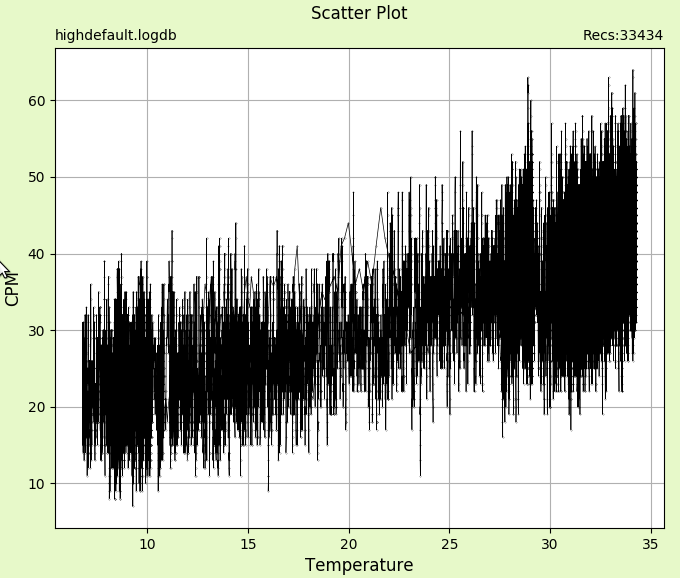
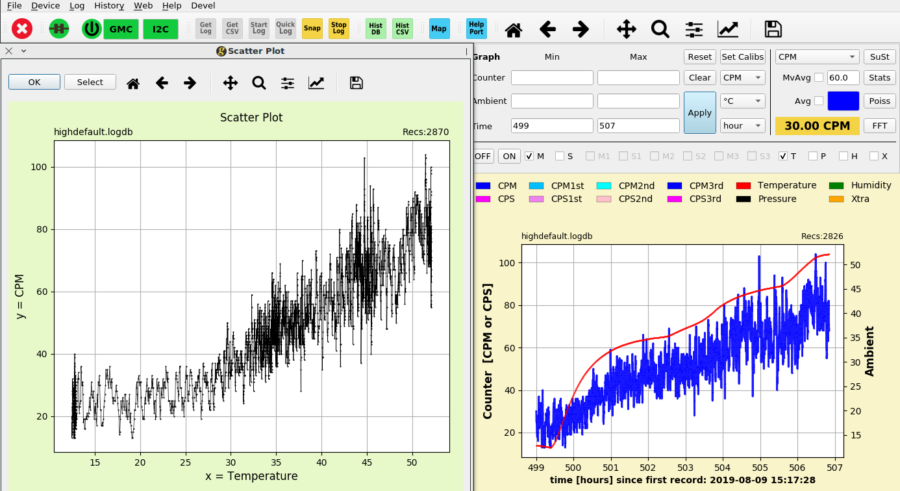
GeigerLog allows to create a scatter plot of CPM versus Temeperature (menu File --> Plot Scatter), which is shown in the next picture for the data shown above.
It shows an almost linear dependence of CPM from Temperature between ~5°C and ~34°C. Not a good sign!
Image Insert:
73428 bytes
|
 |
|
| Reply #24
ullix
    
Germany
1241 Posts |
 Posted - 09/01/2019 : 23:48:55 Posted - 09/01/2019 : 23:48:55


|
One more temperature profile, showing again that the counter's counts are highly temperature dependent!
This time I had used a camping box with an active cooler/heater - based on the Peltier technology - and ramped the temp from ~10°C to over 50°C. This changed the count rate from 25 CPM up to well over 80 CPM!
However, the counter had problems with the temperature. While the I2C electronic and sensors didn't mind the temp, the counter crashed! CPS was returned the same as CPM, the config could not be read out, neither could could the date, the serial number, and various other parameters. Re-connecting did not help, neither did rebooting, nor factory reset. What finally brought the counter back was to remove the battery completely, wait for a minute, and reinstall the battery.
This is a bit of concern for the usability of the counter, because such a temp can be reached simply by leaving the counter in a car standing in the sun!
But even at the lowest temperature, the counter's reading of CPM are still too high for my location!
Image Insert:
196190 bytes |
 |
|
| Reply #25
ullix
    
Germany
1241 Posts |
 Posted - 09/02/2019 : 04:34:12 Posted - 09/02/2019 : 04:34:12


|
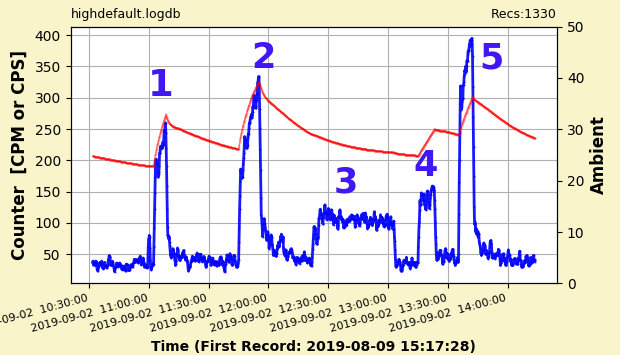
Well, well, so my counter with its black(!!!) tube is not only temperature sensitive, but also light sensitive!
See the pic, peaks 1,2,5 are a desktop halogen lamp at max setting, 4 the same lamp at low setting, and 3 a LED flashlight.
Red is the temperature; the halogen lamp is hot, warming up the arrangement a little bit, while the LED remains cold.
It does look like the M4011 can be very light sensitive independent of it being a clear glass tube or a blackened glass tube.
Image Insert:
57602 bytes |
 |
|
| Reply #26
ullix
    
Germany
1241 Posts |
 Posted - 09/03/2019 : 00:14:51 Posted - 09/03/2019 : 00:14:51


|
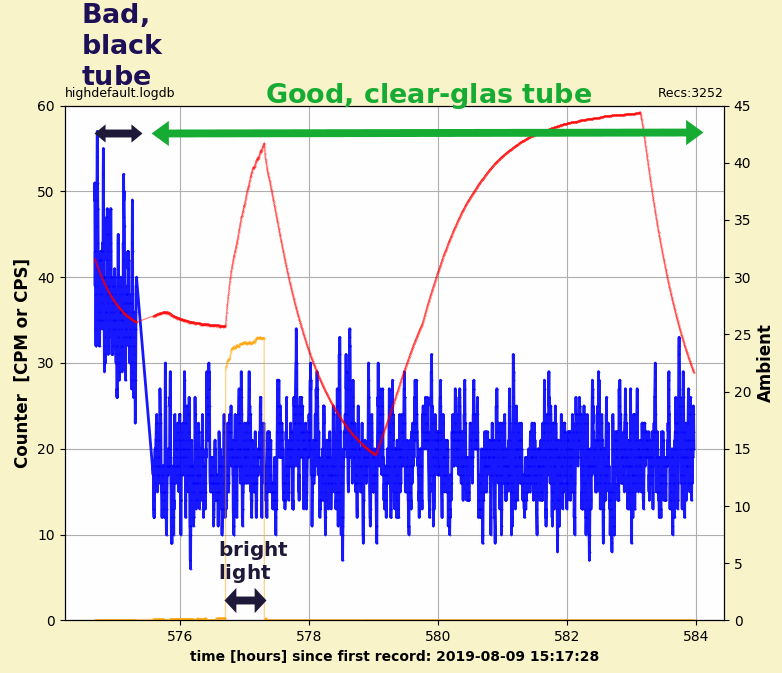
One question remains: what causes the temperature and light sensitivity, is it the tube or the counter itself? So I exchanged the M4011 2017 tube with blackened glass with one M4011 2017 tube with clear glass, and measured again.
Image Insert:
102281 bytes
The result couldn't be any clearer: the background count rate did go down from the well over 30CPM to the expected below 20 CPM. Shining a bright light onto the naked tube (which made the count in the black tube go up to 300CPM) did not change the count rate at all. And ramping the temperature (red curve, right scale, °C) up and down also had zero effect.
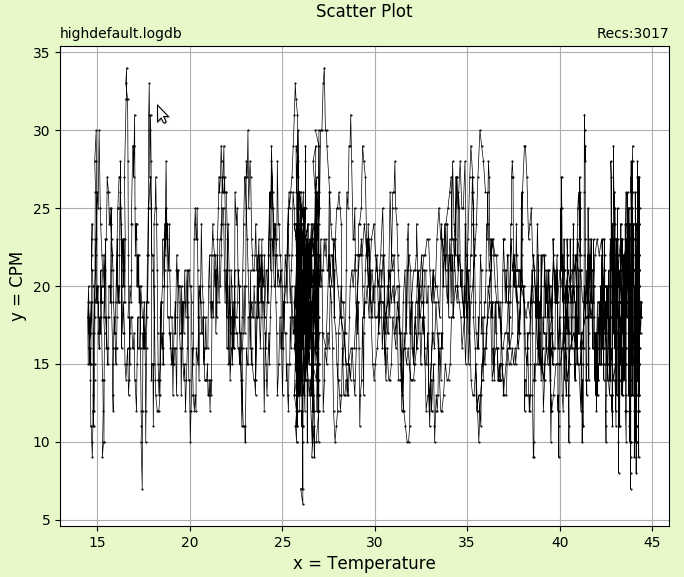
And here is the scatter plot confirming it.
Image Insert:
116117 bytes
Conclusion:
Increased background is not due to the Russians (my apologies to them). It is due to the Chinese! as the manufacturer of the tubes.
More than 2 years back http://www.gqelectronicsllc.com/forum/topic.asp?TOPIC_ID=4540 I had observed the light sensitivity of a M4011 tube. GQ had responded by introducing the blackened version of the M4011 tube, that seemed to solve this issue. But it didn't, as I have shown now.
And it is not just light sensitivity, it is also temperature sensitivity, and even at room temperature the tubes create spurious increases of background, in my case from below 20CPM to over 30CPM, resulting in my suspicion of some global nuclear fallout effect, which has turned out to be a wrong suspicion!
I have four M4011 tubes, of which one is blackened. Out of those 4 tubes, 2 (one clear, one black) are light- (and temperature-) sensitive, that is every second tube. If this undesirable sensitivity to light and temperature is a rare effect, what are the chances of me getting 2 of them?
So, I conclude it is not a rare effect, but rather common! I have no idea why the M4011 is behaving as it does, but it sure looks like the M4011 is a really crappy tube with unpredictable behavior.
Users of the GMC counter won't know if their tube is ok or not. The outer and inner appearance (in the blackened tube case you can't even look inside anymore) is perfectly alright. Unless you have a very good idea of what the count rate should be, you can't tell that anything is wrong. It is even giving a count distribution with a perfect Poisson fit, see above.
And then it might lead you to a wrong suspicion, as it did in my case. What is the value of a world-map of count rates, when a good portion of them may be simply wrong?
Makes me wonder how GQ will address this problem. Changing to SBM20 tubes perhaps?
|
 |
|
| Reply #27
EmfDev
    
2391 Posts |
 Posted - 09/03/2019 : 09:34:42 Posted - 09/03/2019 : 09:34:42


|
| Thank you for testing ullix, I'll let our engineers know about this. |
 |
|
| Reply #28
Damien68
    
France
780 Posts |
 Posted - 09/03/2019 : 14:12:59 Posted - 09/03/2019 : 14:12:59


|
What makes the black on a 4011 black, in closer look, apparently it is a external plastic sheath.
In my opinion, the tube itself must be the same.
Certainly '4011 Black' = '4011 Clear' + black sheath
|
Mastery is acquired by studying, with it everything becomes simple |
Edited by - Damien68 on 09/03/2019 14:16:56 |
 |
|
| Reply #29
ullix
    
Germany
1241 Posts |
 Posted - 09/03/2019 : 23:06:54 Posted - 09/03/2019 : 23:06:54


|
@Damien: that is what it looks like. The black lacquer/sheath/shrink tubing or whatever it may be looks like covering the tube pretty well, up to and including the outer edges of the metal connector. And even with my brightest light I can't shine through the black tube. Looks ok to me.
Yet, they clearly are light sensitive. And it is the tube, not the counter, which the last experiment has demonstrated.
Bottom line remains: the counts may or may not be valid, you can't tell.
|
 |
|
| Reply #30
Damien68
    
France
780 Posts |
 Posted - 09/04/2019 : 05:16:03 Posted - 09/04/2019 : 05:16:03


|
The specifications of the M4011 tube are not found, but it is often compared to the SBM20.
SBM20 tube have Inherent counter background at 1 cps.
also in principle, we can't expect a 'reliable' measurement with a precision greater than -0 / + 60CPM
This is theoretical, but it does't preclude taking measurements and interpreting them with care.
After, the best instruments are never ideals, but allow to do things by knowing them well. Also intelligent experiments are rewarding.
But sure, we could expect data sheets on the tubes a little more provided, like we can found for all other electronic components.
PS: Pancake tube of GMC600 is specified with Inherent counter background at 0.5 cps
|
Mastery is acquired by studying, with it everything becomes simple |
Edited by - Damien68 on 09/04/2019 05:46:24 |
 |
|
| |
 Topic Topic  |
|

