| Author |
 Topic Topic  |
| Reply #1
StevenL

Canada
75 Posts |
 Posted - 05/21/2023 : 03:22:05 Posted - 05/21/2023 : 03:22:05


|
Cool, thx. OK, so here goes. I was able to read in your default db file in CSV, doing as required, I selected columns 1 and 2 in this case, to get Gate Time and then CPM.
For my own case, I was simply trying to read in the direct output from the GMCmap data file, downloaded. The top few lines are as follows:
# DateTime, CPM, ACPM, uSv/h, Latitude, Longitude
"2023-05-16 20:48:40","14","12.97","0.09","45.314234","-75.9219635"
"2023-05-16 20:38:37","16","12.97","0.10","45.314234","-75.9219635"
"2023-05-16 20:28:35","11","12.97","0.07","45.314234","-75.9219635"
Unless I am misreading something, the DateTime format looks correct, and when I try to try to read in based on dialog box guidance, I chose columns 0 and 1 to see the same data. It appears to read in, no errors shown, but no graph shows up, and when I print out the data in the log monitor, it shows that the CPM has been read in, but not the DateTime.
I must be making an error, even an obvious one, but I am missing it. I looked at the default db csv and their are more header lines that I dont really understand, but I assumed the headers (and in my case there is only one) are ignored. I assumed the # sign in the header is basically a comment line that Geigerlog ignores.
Any idea? Am I simply being obtuse? It happens :)
Steven Lightfoot (PS: I love your software). |
Steven Lightfoot, Eng.
Ottawa, Ontario, Canada |
 |
|
| Reply #2
ullix

Germany
1242 Posts |
Posted - 05/21/2023 : 04:00:39
|
I know, the obvious is sometimes hard to see ...
#  Index,        DateTime,      CPM,      CPS
   0, 2019-01-11 19:32:14,      181,        6
   1, 2019-01-11 19:32:18,      197,        3
How many quotation marks (like >"<) do you see in my sample?
And in yours?
"2023-05-16 20:48:40","14","12.97","0.09","45.314234","-75.9219635"
"2023-05-16 20:38:37","16","12.97","0.10","45.314234","-75.9219635"
"2023-05-16 20:28:35","11","12.97","0.07","45.314234","-75.9219635"
|
|
|
| Reply #3
StevenL
Canada
75 Posts |
Posted - 05/21/2023 : 16:09:02
|
Indeed. I get it now, and it is clear, once I look back at your default db csv and the original one I am trying to use.
My confusion perhaps was exacerbated by the Guidance section in the dialog box which explicitly uses quotation marks to describe the format of the DateTime info. Maybe a future version could modify the Guidance to remove the quotation marks? Just a friendly suggestion.
So here is my next question - The format from the Geigermap data seems to come automatically with quotation marks, unless there is a way in the map data section to select the form of the csv data that I don't know about (which is entirely possible).
In your experience, what would be the easiest way to get and use Geiger map data in the exact csv form that Geigerlog requires?
All help is greatly appreciated!
Steven Lightfoot |
Steven Lightfoot, Eng.
Ottawa, Ontario, Canada |
|
|
| Reply #4
ullix
Germany
1242 Posts |
Posted - 05/21/2023 : 22:27:03
|
quote:
In your experience, what would be the easiest way to get and use Geiger map data in the exact csv form that Geigerlog requires?
Most of the time my universal tool for such tasks is Geany, an editor available for all OS: https://www.geany.org/
Depending on the layout of any data, a spreadsheet like Excel, Libreoffice, might also work.
|
|
|
| Reply #5
StevenL
Canada
75 Posts |
Posted - 05/22/2023 : 07:46:57
|
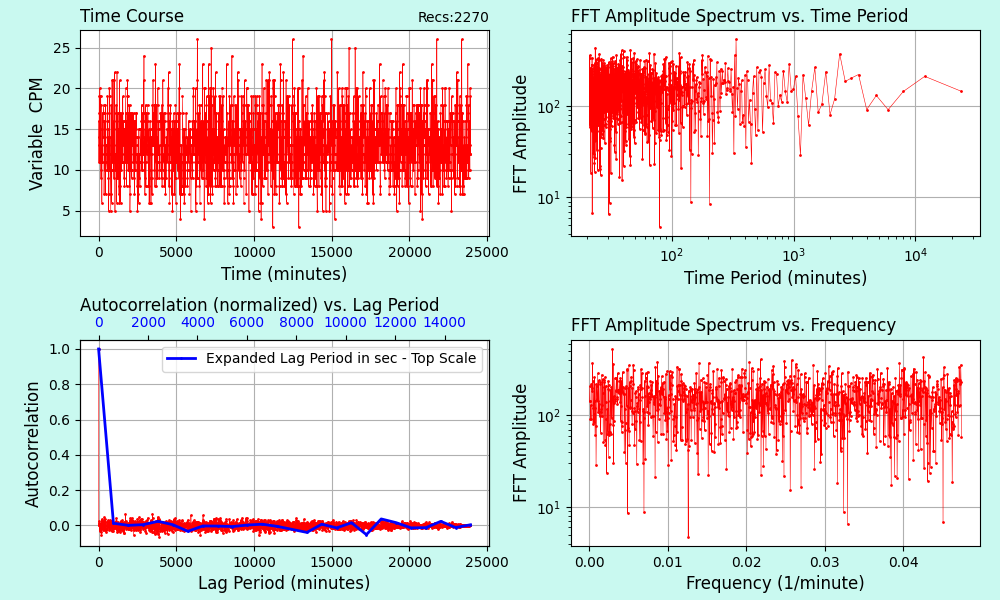
OK thank you, I sorted it out, using Open Office spreadsheet. I have 17 days of data at 10 min samples (undersampling per your guidance) and the Poisson looks good at R .995, and I am posting the FFT here below, which was the point of this exercise (to get some longitudinal data to see if there is any daily or other periodicity - which you advised not to expect).
I am not an FFT expert by any means, but based what I know within the frequency domain plot, it looks mostly noise and nothing is showing up. Any comments? Thanks as always, Steven Lightfoot
|
Steven Lightfoot, Eng.
Ottawa, Ontario, Canada |
|
|
| Reply #6
StevenL
Canada
75 Posts |
Posted - 05/22/2023 : 08:32:02
|
quote:
Originally posted by ullix
Wow, digging deep into the much loved Poisson statistics!
I figured my answer would need some attachments, which I couldn't post here, so I started an answer on the GeigerLog site under the heading:
GeigerLog as Doomsday Predictor
https://sourceforge.net/p/geigerlog/discussion/general/thread/2eee6dd990/
While this heading may not be fully serious, the content should be!
I think this quote reflects the most important restriction to do any Poisson-statistice-educated setting of alarm levels: quote:
... with a maximum of one false alarm per month on average.
which implies that you have to bite the bullet in defining how much nuisance you want to bear by understanding the nature of the statistics of radioactive decay.
Download data and spreadsheet to experiment with yourself.
P.S. one request: please avoid the "Reply with Quote" button in this forum whenever possible. This really blows up the thread for mostly no advantage. To quote single pieces from comments, which you may need for good reference, you can always use the "Insert Quote" button in the editor.
I finally had a chance to review the info you posted in Source Forge, and I agree with your approach. I love your work. I was assuming one could actually do the integration manually if you knew the Poisson equation parameter(s), but you used the Excel Poisson function which is easier and faster. You basically integrated backwards from infinity to until you got the total summed probability you initially proposed (1 event every two months), and then the corresponding CPM value was 42.
I got confused at first with the terminology 'false alarm', but you did get my meaning. The basic point is that with your assumed background radiation distribution, if you see a reading of 42 once every two months (but not more) you could assume this is background. If you saw a lot of 42s (more than one per 2 months) you could assume you were reading some rad source greater than background.
I have noted and filed all this, for future reference, thank you!
Steven Lightfoot, Eng.
|
Steven Lightfoot, Eng.
Ottawa, Ontario, Canada |
|
|
| Reply #7
ullix
Germany
1242 Posts |
Posted - 05/22/2023 : 23:51:46
|
Correct.
In the meantime GeigerLog has got a more powerful feature to deal with alarms and reduce frequency of false alarms. One can now define that the average of the last 1 ... 60 readings is higher than a configured high alarm level, or lower than a configured low alarm level.
I put it as a challenge to you to determine the probability of the occurrence of 1, 2, 3, ... consecutive values being on average higher than a configured alarm-level = X!
P.S.: the FFT - data look excellent, and absolutely nothing to see ;-)
One of the rare occasions where the FFT does show an effect is posted here:
https://sourceforge.net/p/geigerlog/discussion/general/thread/b43896fc28/#7b62
It is about the memory-use swings in a long-run of GeigerLog on Windows.
|
|
|
| Reply #8
StevenL
Canada
75 Posts |
Posted - 05/23/2023 : 03:11:55
|
Ullix,
Thank you for all this. I now need to wrap up my Geiger work for six months, and move back to my Arduino work. In Arduino I need to be able to control some DC motors, and this is my top priority. In addition I am playing with the Arduino Uno random number generator (and random seeding) so all this discussion about random variables and Poisson has been helpful.
When I get access to some K salts, maybe later this summer, I will do some more tests (and with my kids who are interested). I may also upgrade to the next version of Geigerlog.
I have learned a lot, and will come back for more.
If you ever wish to contact me, I am Steven D. Lightfoot on LinkedIn.
Thank you. |
Steven Lightfoot, Eng.
Ottawa, Ontario, Canada |
|
|
| Reply #9
StevenL
Canada
75 Posts |
Posted - 05/24/2023 : 06:55:24
|
Ullix,
I just wanted to add that I think your sw Geigerlog has a LOT of potential also as a statistical analysis tool. I dont know your plans for it, or if you are just noodling around, but I see it has real potential.
As I play more and more with Arduino, and start to get enviro data and other variable data, I would consider importing into Giegerlog to run some tests. What is holding me back for now, is that the Arduino Uno does not appear to have a DateTime function, and would need to interface with my PC, but I haven't figured out code yet to import DateTime via USB. I am not sure its easily possible.
Anyway, I like Geigerlog!
Steven Lightfoot |
Steven Lightfoot, Eng.
Ottawa, Ontario, Canada |
|
|
| Reply #10
ullix
Germany
1242 Posts |
Posted - 05/25/2023 : 00:37:27
|
Steven, GeigerLog allows long-time recording of any data, be it Geiger counts or values like Temperature, Barometric Pressure, CO2, simulated data, and so on. If any statistical tool is missing for dealing with such time-course data, I will add it.
However, I don't see anything missing - speak up if you see a need!
For your playtime with Arduino I'd like to make a suggestion: skip the Uno and go with a serious chip, like the ESP32. It has much more power, much more memory, much more disk space, and it comes with WiFi by default (and Bluetooth). So e.g. getting the time, like from Atomic clock time servers, is no problem. And lots more.
Look for the "AmbioMon Device" in the GeigerLog config and code. This is an interface for a full blown ESP32 device, communicating either by WiFi or by Serial Port. It all works.
|
|
|
| Reply #11
StevenL
Canada
75 Posts |
Posted - 05/25/2023 : 02:46:32
|
Ullix,
Thank you for the great info. Although I am an experienced (mechanical) engineer, I am pretty much a beginner with the (modern) details of coding, data acquisition and electronics, at least at the fine detail level. For now I will stick with the Uno while I get up to speed on Arduino code and C++, but great idea to move on to more sophisticated boards with more features, eventually.
My main goal is to A) maybe move into the nuclear energy field (one of the reasons I am doing self-education on ionizing radiation) and B) develop some specific mechatronics projects for home (at least for now) use. I have a long way to go.
If I have any stats questions, I will will back to you.
Steven Lightfoot |
Steven Lightfoot, Eng.
Ottawa, Ontario, Canada |
|
|
| Reply #12
ullix
Germany
1242 Posts |
Posted - 06/23/2023 : 03:34:52
|
GeigerLog has IoT support since very long, and this has just been updated to explicitly support 'Tasmota' devices.
First thing tested is a set of electric sockets, which allow switching (up to 3.6 kW loads!) and measuring voltage, current, power, cosine-phi and other stuff.
In my experience quite reliable at least for voltage, see this pic:
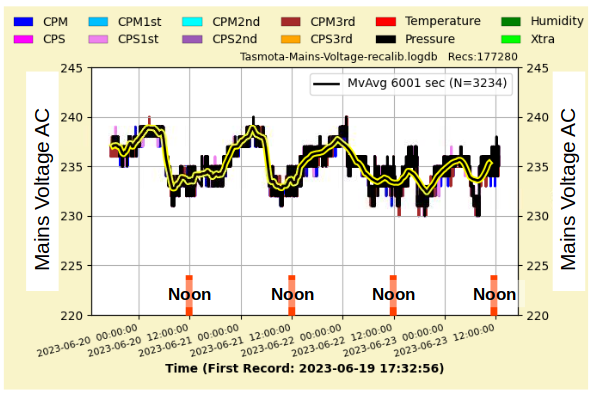
Though I am a bit surprised: where are the '220V' we are supposed to have? And do you notice the day-time cycle?
More on this topic on the GeigerLog site:
https://sourceforge.net/p/geigerlog/discussion/features/thread/d10076b63a/
And: a Tasmota based Geiger counter may be coming, made by the folks in Ukraine. Will be supported by GeigerLog, once available.
https://sourceforge.net/p/geigerlog/discussion/features/thread/02400c685d/
|
|
|
| Reply #13
ullix
Germany
1242 Posts |
Posted - 04/25/2024 : 23:12:02
|
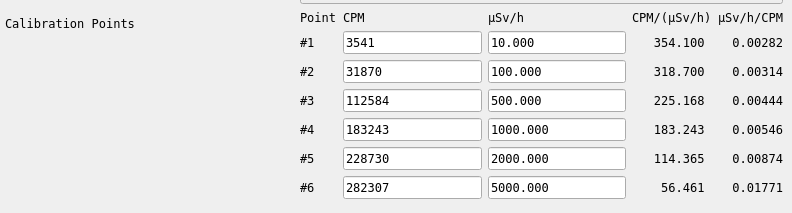
The upcoming GeigerLog Version 1.5 does now understand some of the latest firmwares where a 6-point-calibration is used.
If you have a GMC-800, GMC-600, or GMC-500 with the latest firmware you might be interested to see the configuration.
Download a pre-release 1.5.0pre78 or later from here:
https://sourceforge.net/p/geigerlog/discussion/devel/ Anything not working as expected? Please, report.
This example from a GMC-600+ counter:
 |
|
|
| Reply #14
ullix
Germany
1242 Posts |
Posted - 05/15/2024 : 07:56:38
|
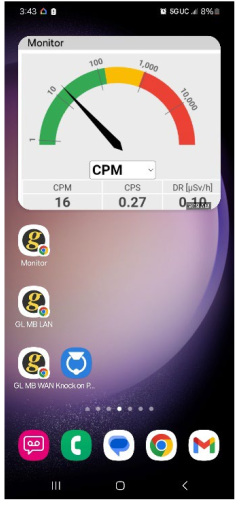
If you are interested in monitoring GeigerLog from your mobile phone, while GeigerLog is resting on a Cloud, you might want to look into this article
HOWTO - Using GeigerLog's Monitor feature on Your Mobile contributed by user Simon Harrison.
Find it on the Articles page https://sourceforge.net/projects/geigerlog/files/Articles/
quote:
his setup guide is for those who'd like to use their mobile smartphones to access Ullix�s GeigerLog Web Monitors. Specifically, these instructions demonstrate how to remotely access data from your GQ Electronics (GQE) GMC Geiger-counter via the GeigerLog software installed on a cloud based webserver, while connected to a public cellular or Wi-Fi network or other non-private wide area network (WAN).
Example:
|
|
|
| Reply #15
ullix
Germany
1242 Posts |
|
| Reply #16
ullix
Germany
1242 Posts |
|
| Reply #17
nonus

38 Posts |
Posted - 08/16/2024 : 07:35:33
|
| I'm wondering if it's possible to transfer radon gas readings to a gq map via the GeigerLog app? |
Edited by - nonus on 08/16/2024 07:36:06 |
|
|
| Reply #18
ullix
Germany
1242 Posts |
Posted - 08/16/2024 : 22:25:32
|
GeigerLog can send data to the server in the format which the server expects. It CANNOT reprogram the server!
You are posting the same question in multiple threads. This is NOT helpful! I continue at the other place. |
|
|
| Reply #19
WigglePig
31 Posts |
Posted - 08/19/2024 : 23:47:49
|
Many thanks ullix, this software really is rather good and very useful.
I have a question regarding window sizing...I'm sure you may remember that we chatted about this some while back before the settings were rolled into the config file.
WHat I have noticed is that whilst the main window sizing, scaling, etc is absolutely fine there is an issue where sub-windows, like settings pages, etc, are too large to display on the screen so I can't see some of the widgets. There isn't any option to maximize/fit to screen/shuffle the window around so it's a bit problematic.
Do you have any tips? |
|
|
| Reply #20
ullix
Germany
1242 Posts |
Posted - 08/20/2024 : 01:54:12
|
Yeah, this should not happen.
I don't see it on my test systems. Can you please point out again where it occurs, and I will work on a fix. |
|
|
| Reply #21
WigglePig
31 Posts |
Posted - 08/20/2024 : 03:12:45
|
quote:
Originally posted by ullix
Yeah, this should not happen.
I don't see it on my test systems. Can you please point out again where it occurs, and I will work on a fix.
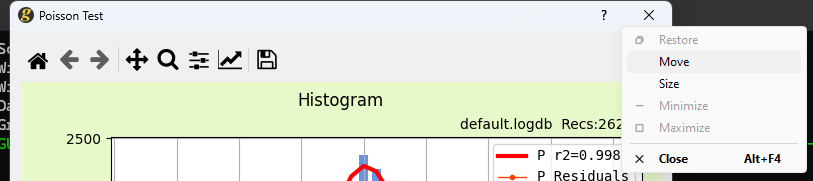
It seems to happen whenever there is a biggish window opened as a result of some action in the application. I have seen it when opening the extended configuration dialogue and also when requesting data stats.
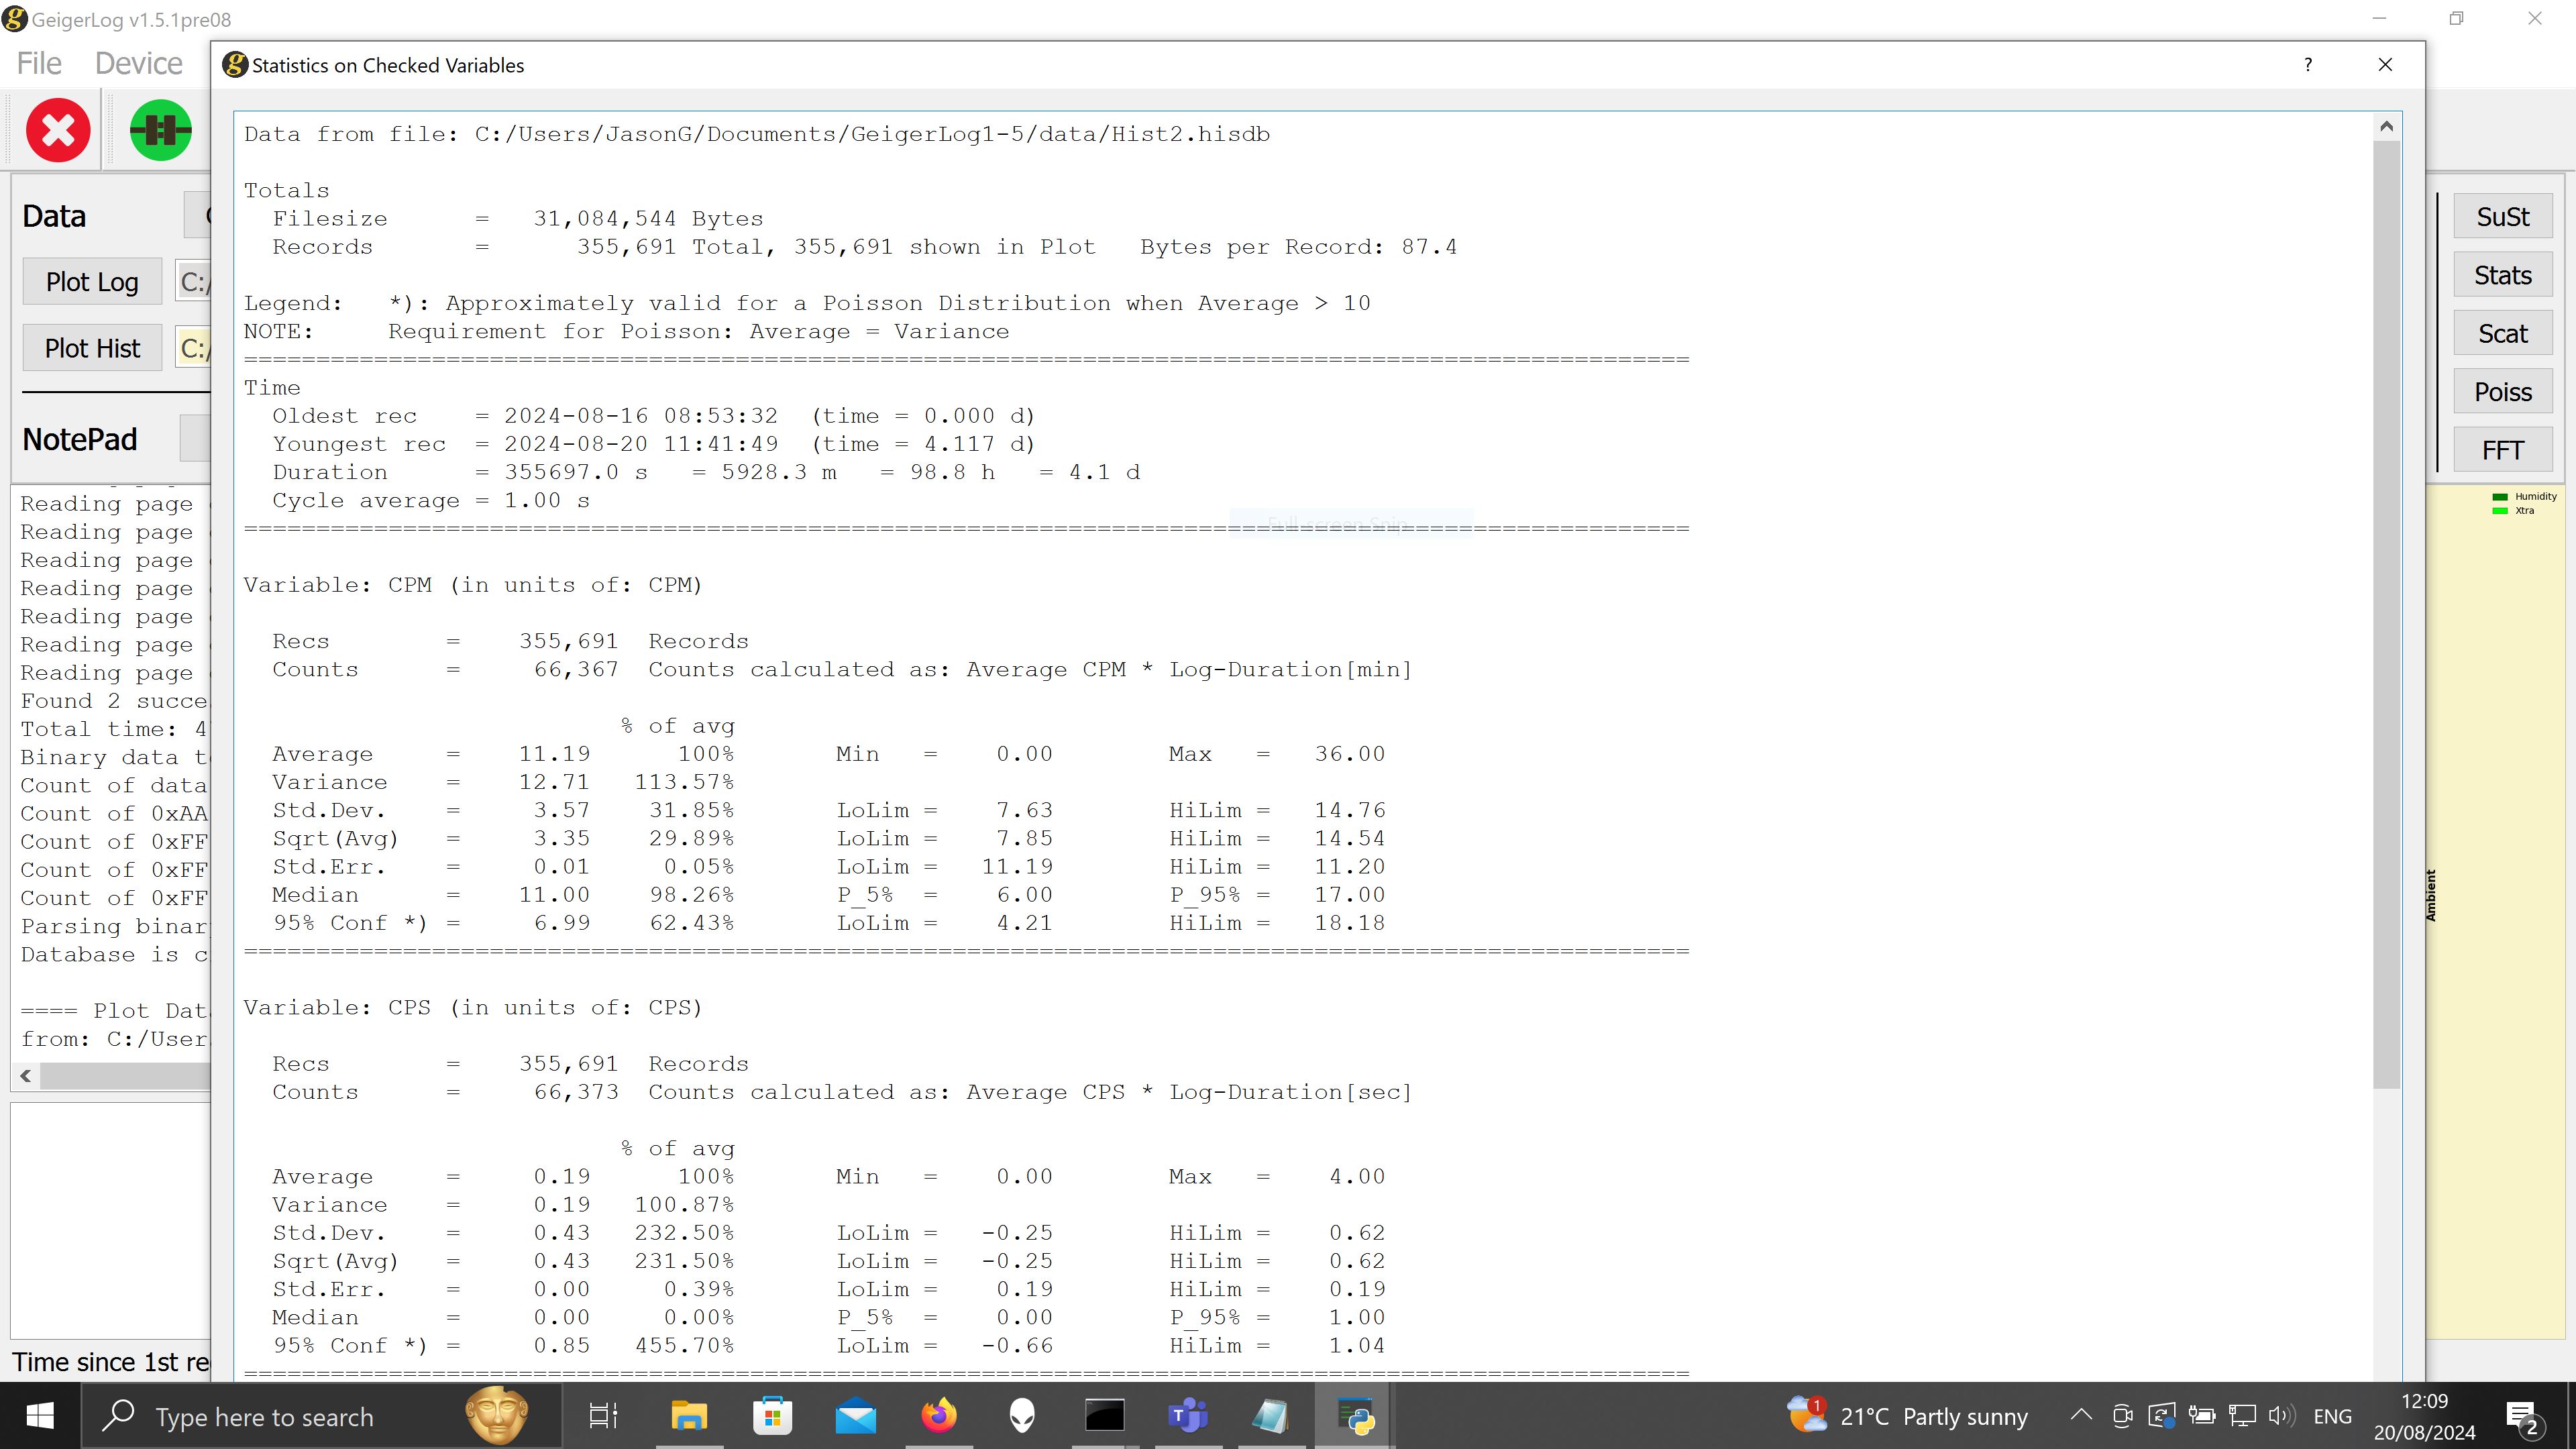
Here is an example where the window runs off the screen and cannot be resized or slid back into view.
Hope that helps! |
|
|
| Reply #22
ullix
Germany
1242 Posts |
Posted - 08/20/2024 : 03:39:37
|
It is not really helping.
The stats window is coded for a size of H1100xH750. Displays today have a size of 1920x1080, so there should be ample space. But height-wise it should fit even on the minimal size supported by GeigerLog.
What is your screen size in pixels? Are you using any any OS-specific overall screen enlargement?
You see the scrollbar on the right side of the stats window. So you can shift the content up and down and see everything there is.
To enlarge or shrank the size of the text-fonts you can also do: press and hold the CTRL-key, and turn the mouse wheel as desired.
I'll make the window smaller in the next release, but it is on the brink of becoming inconvenient!
Next releases are pre-releases, and you find them here:
https://sourceforge.net/p/geigerlog/discussion/devel2/
Always take the last one available, but be aware that there may be bugs. |
|
|
| Reply #23
WigglePig
31 Posts |
Posted - 08/20/2024 : 05:20:05
|
quote:
Originally posted by ullix
It is not really helping.
The stats window is coded for a size of H1100xH750. Displays today have a size of 1920x1080, so there should be ample space. But height-wise it should fit even on the minimal size supported by GeigerLog.
What is your screen size in pixels? Are you using any any OS-specific overall screen enlargement?
You see the scrollbar on the right side of the stats window. So you can shift the content up and down and see everything there is.
To enlarge or shrank the size of the text-fonts you can also do: press and hold the CTRL-key, and turn the mouse wheel as desired.
I'll make the window smaller in the next release, but it is on the brink of becoming inconvenient!
Next releases are pre-releases, and you find them here:
https://sourceforge.net/p/geigerlog/discussion/devel2/
Always take the last one available, but be aware that there may be bugs.
Apologies for the large screenshot!
MY screen size is 3840x2160 and the standard/default scaling for this unit is 250%. Reducing this to 200% or lower means I can see it all OK, including buttons and widgets but this makes all the text, etc, quite small. The slider doesn't help since widgets/buttons are at the bottom of the window which is forced off the bottom of the screen. |
|
|
| Reply #24
ullix
Germany
1242 Posts |
Posted - 08/21/2024 : 02:17:40
|
So you have a 4k monitor and suffer from all the programs not really supporting this high resolution. And they don't, neither on Windows, nor Linux,
nor Mac. So you make a scaling of 250% in order to make it legible. Let's do some calcs:
A resolution of 3840x2160 pixel, after dividing by 250%, becomes a resolution of 1536x864.
The minimum height for GeigerLog Sub-Windows like Stats, Scat, Poiss etc is 900 pixel. Thus too much for your scaled Windows!
When you scale by 200% (not 250%) you end up with a resolution of 1920x1080, which now is the default size of today's monitors, and all GeigerLog windows will fit!
If this still doesn't show the programs/their text in the size you need, you may have purchased the wrong monitor. You need a physically larger
one, like 30+ inches, or even 40+ inches. Resolution is not so important; FullHD (1920x1024) is ok, (1920x1200 is better).
One last hope: on my Windows11 I see a "?" on the top-right end of the window. When I right-click on this, select "Move" and NOT use the
mouse, but the cursor keys, I can shift the window up/down/left/right as much as I want. Not sure if this is available in Windows10?
|
Edited by - ullix on 08/21/2024 02:22:00 |
|
|
| Reply #25
WigglePig
31 Posts |
Posted - 08/21/2024 : 03:06:30
|
Indeed, I realised my error pretty quickly when playing around with the scaling. I don't have much choice regarding the monitor size and resolution since this is on a laptop PC; I could use an external monitor but then this would be very much less portable so I'm not keen on doing that really.
The context menu "move" and "resize" are greyed out in this context, presumably because the window is too large for the scaling.
Thanks for getting back to me and apologies for not digging around a bit before messaging you! |
|
|
| Reply #26
ruslan

Poland
3 Posts |
Posted - 08/22/2024 : 16:38:42
|
| I have a problem with running GeigerLog on macOS - I receive the following error message: "/Applications/geigerlog/GeigerLog.sh: line 55: 35881 Segmentation fault: 11 $myvenv/bin/python3 geigerlog.py $1 $2 $3 $4 $5 $6 $7 $8 $9", along with a message that Python unexpectedly quits. Can someone help me with this? |
|
|
| Reply #27
ullix
Germany
1242 Posts |
|
| Reply #28
ruslan
Poland
3 Posts |
Posted - 08/23/2024 : 14:43:19
|
New problem:
GeigerLog Startup -------------------- in SETUP mode ---------------------------
startup: Command Line: ['geigerlog.py', 'setup']
startup: System Python: python3.13
startup: Virtual Environment: '__venv1.5.1pre09'
startup: Virtual Environment: currently using Python version = 3.12.5
startup: Python Versions existing on this computer:
startup: /usr/bin/python3
startup: None of the installed Python versions are supported by GeigerLog!
startup: Supported versions are: python3.12, python3.11, python3.10, python3.9, python3.13
startup: See the GeigerLog manual for guidance on installing Python
ruslansalamatin@mbp-ruslan geigerlog %
|
|
|
| Reply #29
ullix
Germany
1242 Posts |
Posted - 08/23/2024 : 22:50:27
|
EDIT: I notice some peculiarity on your system, which I had missed before. It may take more effort to solve. I suggest you file a ticket on the GeigerLog site:
https://sourceforge.net/p/geigerlog/tickets/
and further discussion will be there.
###############
Your system Python is 3.13, and it is the only Python version, yet the Virtual Environment is based on Python3.12. That should be impossible! Had you made any Python changes during GeigerLog installation?
Another problem: Python3.13 is not released yet, and while Python itself is working ok, its package scipy, required for GeigerLog, does not yet work in this Python version.
There is nothing I can do about it.
You should uninstall Python3.13, and install one of the supported Python versions, 3.12, 3.11, 3.10, 3.9.
|
Edited by - ullix on 08/24/2024 00:09:10 |
|
|
| Reply #30
nonus
38 Posts |
Posted - 10/03/2024 : 22:05:15
|
| It doesn't work on Python 3.11 32 bit, many modules don't have a minimum version, for example, matplotlib. Do you have a build for 32 bit processors? I wanted to use intel Atom Z3735 or Atom Z8350. |
Edited by - nonus on 10/03/2024 22:09:55 |
|
|
| Reply #31
ullix
Germany
1242 Posts |
Posted - 10/04/2024 : 00:30:14
|
@nonus: GeigerLog should work on all Python of versions 3.10 or later. Bit size 32 or 64 should not matter (but 64 is recommended).
To understand what is going on in your case I suggest you file a ticket on the GeigerLog site at:
https://sourceforge.net/p/geigerlog/tickets/
This allows you to post files which I do need for review. Please, start GeigerLog with (which OS are you on? I suppose Windows?):
GeigerLog.bat -dvw devel
Log with GL for 2-3 min, then stop and exit. This will have created file geigerlog.proglog.devel. Please, post this file.
If you can't get to logging, please post what the terminal shows after you have tried to start GL in the above matter.
|
|
|
| Reply #32
nonus
38 Posts |
|
| Reply #33
ullix
Germany
1242 Posts |
Posted - 10/21/2024 : 06:29:33
|
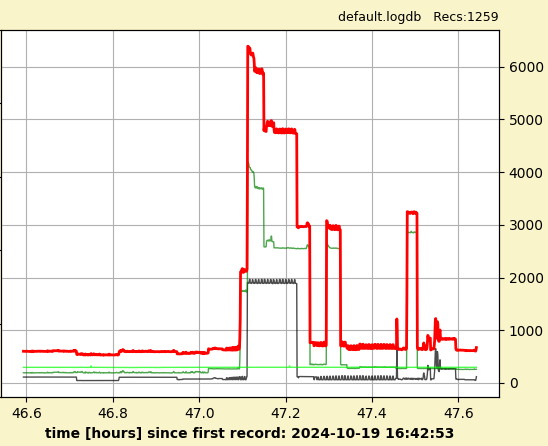
Do you want to know what your current electric power consumption is? Or what it had been during the last months?
GeigerLog can now read out Smart Meters, which are becoming the norm in households, and in particular in German households due to some new regulations benefiting Balcony Power Stations ("Balkonkraftwerke").
The required electronics are simple devices, based on ESP32 embedded CPUs, using the Tasmona operating system. The "Wattw�chter" https://www.amazon.de/dp/B0DDHPZQPX is one of several examples for those devices.
Attached is one example showing the total power (red), and the power on each of the 3 phases of the 3-phase electrical supply. The time-midpoint is when the wake-up clock strikes ;-) Right scale in Watt.
To use these devices, download GeigerLog pre-release 1.5.1pre13 (or a later version) from the GeigerLog Development site https://sourceforge.net/p/geigerlog/discussion/devel2/
The config file in the present pre13 download is configured for the Wattw�chter, but those devices are all identical with respect to configuration or very much alike.
|
|
|
| Reply #34
nonus
38 Posts |
|
| Reply #35
ullix
Germany
1242 Posts |
Posted - 11/01/2024 : 00:27:54
|
@nonus: your file geigerlog.proglog.devel tells me that your system is running just fine; no hint indicating any problem!
I suggest:
Download the latest GeigerLog pre-release, which in the moment is pre14.
https://sourceforge.net/p/geigerlog/discussion/devel2/
It has some changes, which are not yet covered in the manual. Briefly: do not touch the configuration file geigerlog.cfg, instead do all your changes in the custom.cfg file in the same folder.
If your problem is not fixed by this version, then please file a ticket on the GeigerLog site (https://sourceforge.net/projects/geigerlog/ )
Start GeigerLog with:
GeigerLog.bat -dvw devel trace
and let it run until it crashes. Then post full file geigerlog.proglog.zip. |
|
|
| Reply #36
nonus
38 Posts |
|
| Reply #37
gqelectronics.exonerate19
2 Posts |
Posted - 01/02/2025 : 09:54:25
|
I have a GMC-300EPlus device.
Since I only have a Mac computer, I've been running GeigerLog since I bought the device.
I have already downloaded data from the GMC device in the past, but after the latest few OS updates I see erratic connection issues
Counter: GMC-300EPlus (Display shows E+V4)
Computer: Macbook Air M1
OS: Sequoia 15.2
GeigerLog version: 1.5.0
Session log:
==== Connect GMC Device ==============================================================
A device GMC Device was user configured for port: '/dev/cu.usbserial-10'
GMC Device 'GMC-300E+V4Re 4.77' was detected at port: /dev/cu.usbserial-10 and baudrate: 115200
ATTENTION A GMC device 'GMC-300E+V4Re 4.77' was detected, but of a so far unknown model / firmware! (Model: GMC-300E+V4 Firmware: 4.77)
Review the 'Extended Info' for this GMC device. You may have to edit the
configuration file geigerlog.cfg to adapt the settings to this new device.
2025-01-02 17:53:21 Got 256 data bytes, expected 512 for call 'b'<GETCFG>>''.
2025-01-02 17:53:21 GMC TIMEOUT ERROR Serial Port; command b'<GETCFG>>' exceeded 3.0s
2025-01-02 17:53:21 Got 256 data bytes, expected 512 for call 'b'<GETCFG>>''.
2025-01-02 17:53:21 Retrying.
ERROR communicating via serial port. Retrying again.
ERROR communicating via serial port. Retrying again.
ERROR communicating via serial port. Giving up.
2025-01-02 17:53:38 Got 256 data bytes, expected 512 for call 'b'<GETCFG>>''.
ERROR: Could not load proper configuration from GMC counter. Please, retry.
2025-01-02 17:53:39 GMC TIMEOUT ERROR Serial Port; command b'<GETCFG>>' exceeded 3.0s
2025-01-02 17:53:39 Got 256 data bytes, expected 512 for call 'b'<GETCFG>>''.
2025-01-02 17:53:39 Retrying.
ERROR communicating via serial port. Retrying again.
ERROR communicating via serial port. Retrying again.
ERROR communicating via serial port. Giving up.
Device successfully connected
ERROR: Could not load proper configuration from GMC counter. Please, retry.
Failure reading the counter's config - Is counter connected?
==== Device Mappings =================================================================
Mappings as configured in GeigerLog's configuration file geigerlog.cfg.
Device : CPM CPS CPM1st CPS1st CPM2nd CPS2nd CPM3rd CPS3rd Temp Press Humid Xtra
--------------------------------------------------------------------------------------
GMC : - - M M - - - - - - - -
Mapping is valid
2025-01-02 17:53:56 Got 256 data bytes, expected 512 for call 'b'<GETCFG>>''.
2025-01-02 17:53:56 GMC TIMEOUT ERROR Serial Port; command b'<GETCFG>>' exceeded 3.0s
2025-01-02 17:53:56 Got 256 data bytes, expected 512 for call 'b'<GETCFG>>''.
2025-01-02 17:53:57 Retrying.
ERROR communicating via serial port. Retrying again.
ERROR communicating via serial port. Retrying again.
ERROR communicating via serial port. Giving up.
ERROR: Could not load proper configuration from GMC counter. Please, retry.
Failure reading the counter's config - Is counter connected? |
|
|
| Reply #38
gqelectronics.exonerate19
2 Posts |
Posted - 01/02/2025 : 10:30:39
|
Update:
I have been able to connect to the GMC-300EPlus and download the history data using
geigerlog-v1.5.1pre19
Session log:
Auto-Started Monitor Server at: 192.168.1.3 Port: 8080
==== Connect GMC Device ==============================================================
GMC Device 'GMC-300E+V4Re 4.77' was detected at port: /dev/cu.usbserial-10 and baudrate: 115200
Device successfully connected
==== Connect DMM Device ==============================================================
==== Connect Bluetooth Device ========================================================
|
Edited by - gqelectronics.exonerate19 on 01/02/2025 10:32:17 |
|
|
| Reply #39
ullix
Germany
1242 Posts |
Posted - 01/03/2025 : 00:49:49
|
@gqelectronics.exonerate19: as you have noticed, GQ has - rather needlessly - changed the ID even of their old GMC-300 counters. In the meantime this change is now included in the latest GeigerLog versions.
As I see from your post, the auto-discovery of the port did work as well.
All seems ok now? If not, I'd prefer any bug reports to be made as a ticket on the GeigerLog Tickets site
https://sourceforge.net/p/geigerlog/tickets/ It gives more flexibiliy in attaching any files. |
|
|
| Reply #40
ullix
Germany
1242 Posts |
Posted - 02/08/2025 : 03:23:34
|
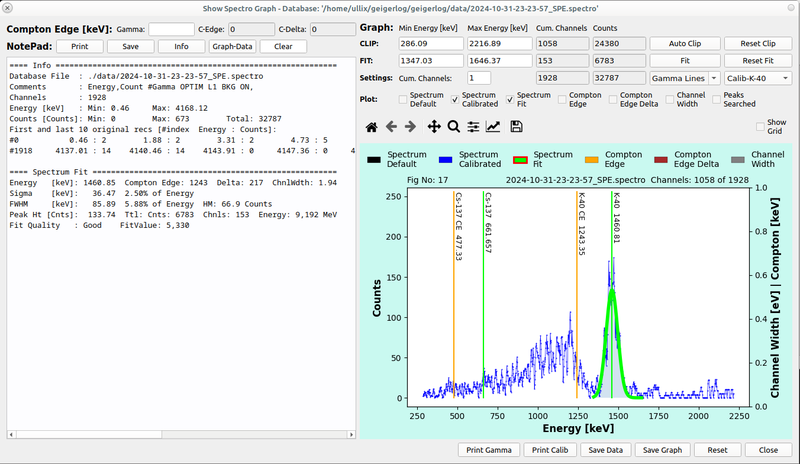
GeigerLog now also handles Gamma-Spectra!
The Gamma Spectrum must be provided as a CSV file (Gamma-Energy, Counts) and can be read into GeigerLog. See menu entry "Spectro".
The displayed Spectrum Graph can then be manipulated with left, right and middle mouse clicks. Clip parts of the Spectrum with CONTROL-Left / -Right mouse clicks. Gamma peaks can be fitted, Gamma lines from a range of isotopes can be shown, Compton-Edges, Single- and Double Escape peaks can also be indicated.
I'd be happy to include any additionally needed file formats for spectrum data; just provide examples.
Download latest version from https://sourceforge.net/p/geigerlog/discussion/devel2/. Latest Development Version is currently 1.6.0pre25.
The picture shows a K-40 recording with its prominent 1.46081 MeV Gamma peak.
|
|
|
| Reply #41
ullix
Germany
1242 Posts |
Posted - 04/25/2025 : 05:41:32
|
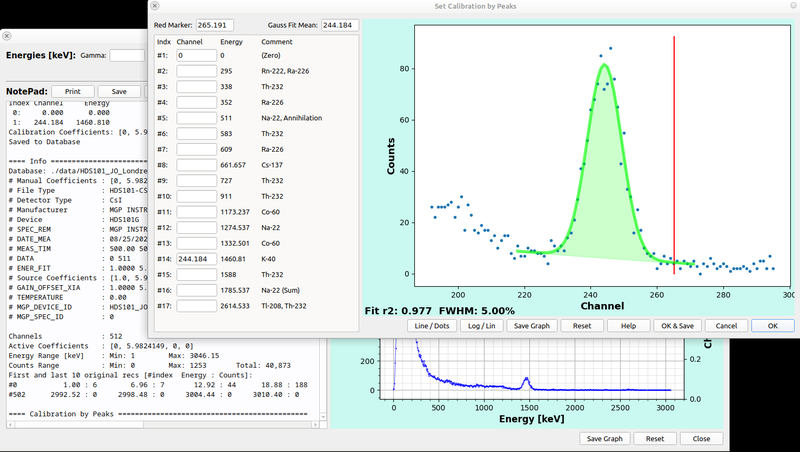
GeigerLog new achievements in handling Gamma-Spectra!
Calibration using fits to the Gamma peaks is the addendum to the latest development version. https://sourceforge.net/p/geigerlog/discussion/devel2/thread/f51c952e8c/
The picture shows it; find more explanation at the download site.
I find it very nice to see these spectra, recorder with still rather simple devices. Makes me wonder when GQ will come up with their own crystal-based detector?
|
|
|
| Reply #42
ullix
Germany
1242 Posts |
Posted - 07/16/2025 : 00:53:00
|
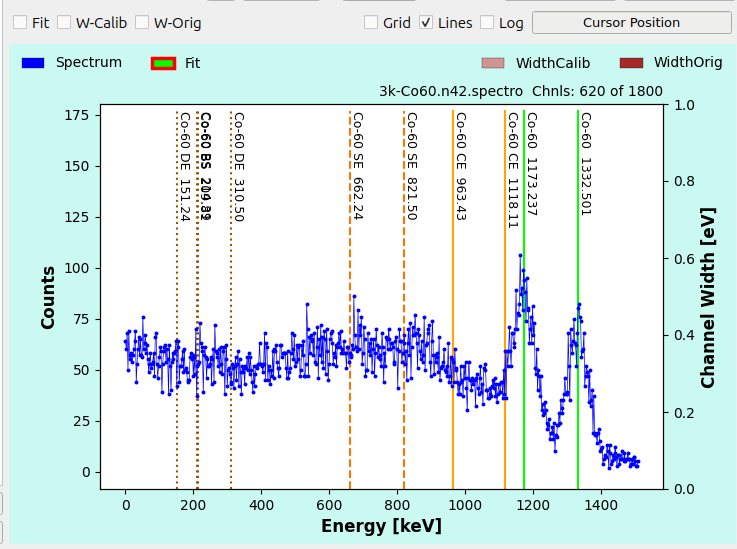
GeigerLog - Version 2.0 has just been released
Many changes and expansions, but the major one is certainly the now full handling of Gamma-Spectra, which GeigerLog can do! Another big change is the switch to the latest Graphic Toolkit PyQt6 - but if all goes well, nobody will notice ...
Consumer spectrometers in the price range from $200 ... $1000 have become available from companies like RadiaCode, Raysid, and Measall, and who knows when GQ will follow ;-)
Spectra are a whole lot more complex than counting Geiger counts, though these devices also make good and sensitive Geiger counters, some even at a lower price than sensitivity-comparable Geiger tube devices! Read an intro and details on Gamma Spectrometry in the GeigerLog Manual, chapter "Gamma Spectra in GeigerLog" (page 126ff).
The picture shows a Co-60 spectrum with GeigerLog's annotations.
Downlaod from the usual location:
https://sourceforge.net/projects/geigerlog/
|
|
|
| Reply #43
ullix
Germany
1242 Posts |
Posted - 11/23/2025 : 06:34:25
|
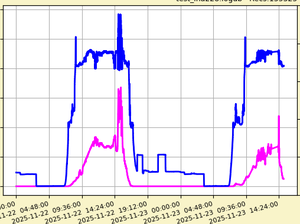
GeigerLog - Version 2.1 has just been released
Quite some enhancements and extensions, and workarounds for bugs in Apple Macs (!) and Python (!). Macs have an extremely(!) poor handling of the Serial Port. I can�t fix that, but can adapt the GeigerLog code so that it does not bother you any more. Older Python versions have a shortcoming, that GeigerLog now works around. You may have never experienced the problem when you used the latest Python version (which fixed this bug).
Much of the other stuff implemented now has become necessary for myself when I started experimenting with a �Balcony Power Station�, i.e. some solar panels to feed power into my regular home AC-power system. Here an example from miserable 2-days in November in Germany. (Blue is solar-voltage, magenta is solar-current).
� DMM now supports up to 12(!) simultaneously used OWON OW18E Digi�tal-Multi-Meters
� The I2C INA228 chip (measuring Volt, Amps, Power) is supported; useful for Solar PV
� FritzBox�s Smart Home Device FritzDect 200 is supported, measuring power use
� Formula Interpreter functions for combining 2 variables by Sum, Difference, Product, Division
� IOT Devices have become easier to handle
� A warning is added regarding the use of free, online MQTT servers, as they are prone to Scammers!
� WiFiServer Devices is now extended, supporting new devices in addition to a RaspiServer, such as:
--- Tasmota Plugs & GMC Geiger counters
With it, you can now have as many GMC Geiger counters on your computer as it has USB ports, and feed data to GeigerLog via WiFi from all of them simultaneously!
Take a deep look at Tasmota Plugs (see in the GL manual): these are sub-10� (including VAT) devices which include WiFi, thanks to an ESP32 microchip, and are fully operated via WiFi. They gave me an idea for a new concept for Geiger counters:
From the counter omit the display, omit the buttons, omit the USB-to-Serial port, omit even any power connector! This brings down the BOM nicely! But put in an ESP32 microchip, which has WiFi built in. Then all viewing of data, all commands will be done on the touchscreen of your Smartphone. No new, separate App is needed, as all will be done using a classic HTML browser, and the code is hosted on the ESP32 itself.
Charging will also be done wirelessly, like Qi loading in modern Smartphones, or like done for ages in your electric toothbrush! Thus the counter can be build ruggedly and completely water tight; usable outdoors, like in weather stations. Hold it while you take a shower � it will be pointless but possible!
Already today the ESP32 can have 16 MByte of storage space, which is 8x more any GMC counter has. Downloading with current GMC speed would be a drama, but now you can have WiFi speed.
For power supply a solar panel might suffice in sunny regions, a battery in disadvantaged countries like mine :-(.
The counter could take a new shape, now that display and buttons and stuff are gone, e.g. more like a Cuban cigar, than like a pack of poker cards.
GQ, if you need a helping hand, you know how to contact me!
|
|
|
| Reply #44
ullix
Germany
1242 Posts |
Posted - 12/23/2025 : 07:30:09
|
A development version of GeigerLog v2.2 has just been released on Sourceforge, look for GeigerLog Version 2.2pre01 on https://sourceforge.net/p/geigerlog/discussion/devel2/ (but always take the last preXY-release available.)
The main change is the support of a Tasmota-Geiger-Counter. Details are explained in the given link, but in short:
You can convert any ESP32 device by installing a generic Tasmota (an Open-Source operating system for ESP32 microchips) and then add a specific App and you have the collecting and saving center device for a Geiger counter! The Tasmota-App (named: geiger.tapp) is provided by GeigerLog, and comes in the GeigerLog package.
Communication with the device is by WiFi. It is well over 20times faster than by USB-To-Serial cable! I reach download speeds of 180...190 kBytes/sec!
Download Speed:
GMC-300S Re 1.03       :   6.6 kbytes/sec,  1.0x
GMC-800 Re1.18         :   9.9 kbytes/sec,  1.5x
Tasmota Geiger Counter : 185.0 kbytes/sec, 28.0x
And the on-board History memory is a whole lot bigger than the GMC's max of 2 MB. It is one of 4MB, 8MB, 16MB, 32MB, 64MB. And the manufacturer Espressif is preparing 128MB. This lasts not for just days, but for even years of storage!
Ideal would be the integration of an ESP32 into your own counter and you get all the goodies for free, and never have to deal with upgrading yourself ;-))
By the way: any ESP32 costs under $4 ! |
|
|
|
Topic |
|
|
|