| Author |
 Topic Topic  |
|
|
igel

Russia
46 Posts |
 Posted - 11/07/2023 : 00:53:26 Posted - 11/07/2023 : 00:53:26


|
| Hi there! I recorded some waves until 39800 CPM but can't find viewer of saved logs that can draw the ghrap with timecodes. But I can't run GeigerLog on my win XP. Is there anybody can help me? |
I am electronic engineer since 1988. Begin to learn EMI fields around us at february 2019 when in our and other villages mounted cell towers. Later I discovered that they emits more than cell data- mind and health control signals known as V2K (Voice TO sKull)
Look my measurements and records on my channel https://www.youtube.com/playlist?list=PL9rKv9lMUZyAV5ilI9rnF7cV5_LNYOFUL
And explanations on this forum https://gqelectronicsllc.com/forum/topic.asp?TOPIC_ID=9003 |
Edited by - igel on 11/07/2023 00:54:32
|
|
| Reply #1
ullix

Germany
1255 Posts |
Posted - 11/07/2023 : 08:39:31
|
quote:
But I can't run GeigerLog on my win XP.
Well, not with the latest version, but if I am not mistaken then Python 3.4 will run on WinXP, and GeigerLog 1.0 does support Py 3.4.
From what I believe your needs are this GeigerLog version should suffice.
If even that is not possible then look for the geigerlog_simple_XYZ versions. They are without a GUI, but they allow to create a CSV file, which can be read into any spreadsheet. That should work even with Python 2.
|
 |
|
| Reply #2
igel
Russia
46 Posts |
Posted - 11/14/2023 : 00:20:41
|
quote:
Originally posted by ullix
Well, not with the latest version, but if I am not mistaken then Python 3.4 will run on WinXP, and GeigerLog 1.0 does support Py 3.4.
From what I believe your needs are this GeigerLog version should suffice.
If even that is not possible then look for the geigerlog_simple_XYZ versions. They are without a GUI, but they allow to create a CSV file, which can be read into any spreadsheet. That should work even with Python 2.
Thanks! I'll try |
I am electronic engineer since 1988. Begin to learn EMI fields around us at february 2019 when in our and other villages mounted cell towers. Later I discovered that they emits more than cell data- mind and health control signals known as V2K (Voice TO sKull)
Look my measurements and records on my channel https://www.youtube.com/playlist?list=PL9rKv9lMUZyAV5ilI9rnF7cV5_LNYOFUL
And explanations on this forum https://gqelectronicsllc.com/forum/topic.asp?TOPIC_ID=9003 |
|
|
| Reply #3
igel
Russia
46 Posts |
Posted - 11/14/2023 : 00:42:55
|
The graph of the beginning of the wave in the afternoon of 6.11.23.
35000 CPM is 700 microsiverts or 70 millirentgen or 70,000 habitual microrentgen.
What natural phenomenon can have such a sharp rise and an even power level for half an hour? And with the same abrupt termination.
Well, I will wait until people begin to understand that they are being very stupidly fooled by "magnetic storms"? In the hope that no one will record schedules and monitor radiation around the clock.
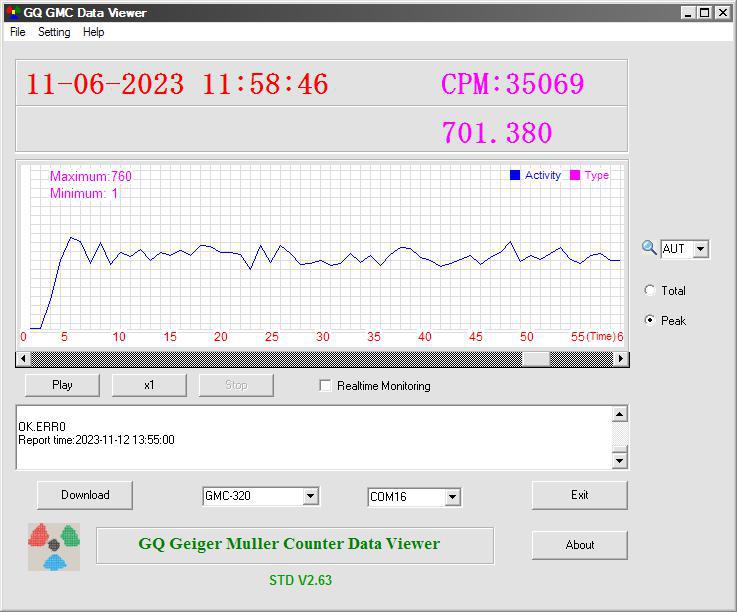
Although their hopes are justified - I have already shown how many monitoring stations there are in the world and in our country - I am the only one and a Muscovite who has not kept logs for a long time
 |
I am electronic engineer since 1988. Begin to learn EMI fields around us at february 2019 when in our and other villages mounted cell towers. Later I discovered that they emits more than cell data- mind and health control signals known as V2K (Voice TO sKull)
Look my measurements and records on my channel https://www.youtube.com/playlist?list=PL9rKv9lMUZyAV5ilI9rnF7cV5_LNYOFUL
And explanations on this forum https://gqelectronicsllc.com/forum/topic.asp?TOPIC_ID=9003 |
|
|
| Reply #4
ullix
Germany
1255 Posts |
Posted - 11/14/2023 : 09:29:27
|
This does not make any sense as an radioactive event!
What is the tube anode voltage? Are you beyond the plateau range?
It could be a result from light exposure. Is the counter light protected?
|
|
|
| Reply #5
igel
Russia
46 Posts |
Posted - 11/14/2023 : 20:58:17
|
quote:
Originally posted by ullix
This does not make any sense as an radioactive event!
Is there any other website or social network? It is very difficult to load pictures and videos here, and I have dozens of logs with such waves and pulses. They happen at different times of the day, lasting up to two hours. 40,000 CPM were found generally underground in the basement.
The anode did not measure, and I did not understand the question about the plateau range. |
I am electronic engineer since 1988. Begin to learn EMI fields around us at february 2019 when in our and other villages mounted cell towers. Later I discovered that they emits more than cell data- mind and health control signals known as V2K (Voice TO sKull)
Look my measurements and records on my channel https://www.youtube.com/playlist?list=PL9rKv9lMUZyAV5ilI9rnF7cV5_LNYOFUL
And explanations on this forum https://gqelectronicsllc.com/forum/topic.asp?TOPIC_ID=9003 |
|
|
| Reply #6
igel
Russia
46 Posts |
|
| Reply #7
ullix
Germany
1255 Posts |
Posted - 11/15/2023 : 00:49:47
|
The Geiger tube plateau - sometimes called Geiger Region - is shown in this picture:

More details in Wikipedia: https://en.wikipedia.org/wiki/Geiger%E2%80%93M%C3%BCller_tube
The problem is that to the right of the Geiger Plateau is the "Onset of continuous discharge". In other words the tube becomes a fluorescent lamp, and anything might happen to the count-rate.
To exclude such an effect you need to know the anode voltage. Problem is that the High-Voltage has a very high internal resistance, requiring a Voltmeter with even higher internal resistance. More details in chapter "The Anode Voltage" in my article "GeigerLog-Radiation-v1.1(CAJOE)-Support" found here: https://sourceforge.net/projects/geigerlog/files/Articles/
Exclude this before you blame any other effect.
And also, put your Geiger counter into a light-tight box when you measure.
|
|
|
| Reply #8
igel
Russia
46 Posts |
Posted - 11/15/2023 : 04:09:09
|
Now I understand. I thought you were talking about the plateau on my chart. And how to adjust the desired voltage in the GMC-320? There are no adjustments there.
And how to find out the service life of the tube? I don't often turn it on for round-the-clock monitoring, fearing that the parameters will go away from the norm.
I carry the device in my jacket pocket or in a black case. When 40000CPM appeared, it was in my pocket. And throughout the schedule, I then took it out and hid it, which did not affect the evenness of the level in any way. |
I am electronic engineer since 1988. Begin to learn EMI fields around us at february 2019 when in our and other villages mounted cell towers. Later I discovered that they emits more than cell data- mind and health control signals known as V2K (Voice TO sKull)
Look my measurements and records on my channel https://www.youtube.com/playlist?list=PL9rKv9lMUZyAV5ilI9rnF7cV5_LNYOFUL
And explanations on this forum https://gqelectronicsllc.com/forum/topic.asp?TOPIC_ID=9003 |
|
|
| Reply #9
igel
Russia
46 Posts |
|
| Reply #10
igel
Russia
46 Posts |
Posted - 11/15/2023 : 09:01:23
|
quote:
Originally posted by ullix
quote:
But I can't run GeigerLog on my win XP.
Well, not with the latest version, but if I am not mistaken then Python 3.4 will run on WinXP, and GeigerLog 1.0 does support Py 3.4.
That was shell:
Python 3.4.4 (v3.4.4:737efcadf5a6, Dec 20 2015, 19:28:18) [MSC v.1600 32 bit (Intel)] on win32
Type "copyright", "credits" or "license()" for more information.
>>>
================== RESTART: C:\Python27\geigerlog\geigerlog ==================
Traceback (most recent call last):
File "C:\Python27\geigerlog\geigerlog", line 63, in <module>
from gutils import *
File "C:\Python27\geigerlog\gutils.py", line 45, in <module>
import sounddevice as sd
ImportError: No module named 'sounddevice'
>>>
It means that it will not work on win XP? |
I am electronic engineer since 1988. Begin to learn EMI fields around us at february 2019 when in our and other villages mounted cell towers. Later I discovered that they emits more than cell data- mind and health control signals known as V2K (Voice TO sKull)
Look my measurements and records on my channel https://www.youtube.com/playlist?list=PL9rKv9lMUZyAV5ilI9rnF7cV5_LNYOFUL
And explanations on this forum https://gqelectronicsllc.com/forum/topic.asp?TOPIC_ID=9003 |
|
|
| Reply #11
ullix
Germany
1255 Posts |
Posted - 11/16/2023 : 01:05:05
|
The life-time of tubes is typically measured in multiples of 10E9 counts. Poor tubes (M4011, J305, etc) on the low end, best ones in the 10E10 region. The SBM20 is claimed to be "at least 2*10E10".
I think this should give no worry unless, of course, you are burning it with overvoltage!
What Python do you try to use: I see in your comment Python 2.7 and 3.4 - which is it? The last GeigerLog version running on Python version 2.X is 0.9.06.
For any errors being reported I refer you to the GeigerLog manual. Read the installation instructions!
|
|
|
| |
Topic |
|