| T O P I C R E V I E W |
| engelbert |
Posted - 02/28/2022 : 06:35:57
question about historical data. In the list is a value ACPM which means this value.
See link: https://www.gmcmap.com/GMHistoryExec-new-data.asp?param_ID=42361086791
I hear from you
Gr Engelbert
|
| 16 L A T E S T R E P L I E S (Newest First) |
| EmfDev |
Posted - 03/08/2022 : 11:58:59
@hugo yes it would be in a sliding window. I will let our team know and see if this will be included in the next update. |
| ullix |
Posted - 03/08/2022 : 09:01:40
There are more things problematic with your data. I downloaded the last page of your data (500 values all from March 8) into GeigerLog.
The time course:
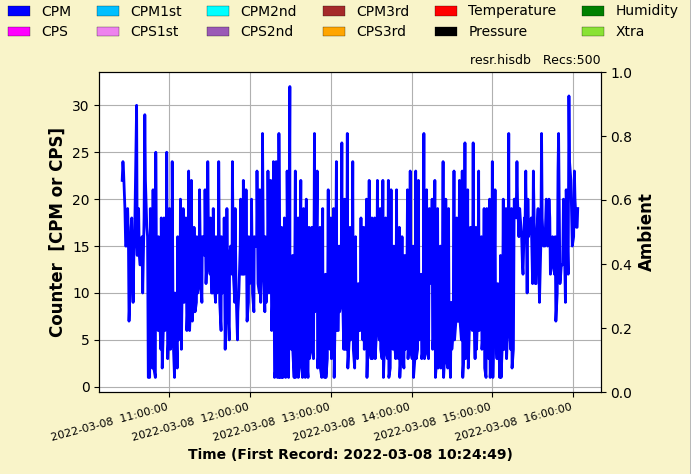
This looks plain awful. Do you notice that the minimal values are all at least 1? There is no zero. Impossible with this kind of data; someone deleted all zeros from the recording!
The critical check on such data is always the "Poisson Test". (Not aware of what Poisson is and means? Read about it in the GeigerLog manual and the articles on my site: https://sourceforge.net/projects/geigerlog/files/ )
For your data the Poisson check looks like this:
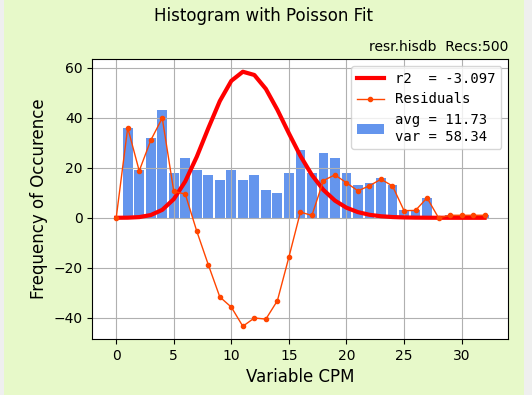
Yuck. This is extra-awful. It tells you something is very, very wrong!
A decent Poisson distribution of real-world counts should look like this (an audio-click recording taken from a GMC counter with GeigerLog):
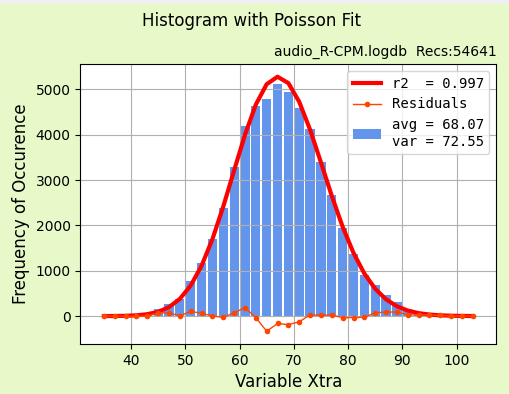
My conclusion: Either you or your counter are being hacked, either intentionally, or inadvertently.
|
| Damien68 |
Posted - 03/08/2022 : 08:53:08
Based on the ACPM data it seems that one input every 2 minutes is consistent and that one line out of 3 is correct.
there seems to be a problem interpreting/synchronizing the data or in data framing, or other thing.
|
| Hugo |
Posted - 03/08/2022 : 08:44:37
[quote]Originally posted by EmfDev
Maybe there should be an option to set how the ACPM is calculated like over and hour/day/week/since power on.
@emfdev I like your suggestion.
It would have to be a rolling period though to be useful?
ie the last hour/n-hours/day/week and should not just start again from zero at the next interval.
I would suggest it could be a rolling window of the last n-hours? Giving freedom to configure for users choice for example 24 for one day, 168 for one week etc. |
| Hugo |
Posted - 03/08/2022 : 08:40:43
@emfdev
I didn't reset anything, but I did power cycle the device. I have a feeling that I might have interrupted the boot in someway? I have since restarted the device again and the APCM seems to be more realistic since. |
| ullix |
Posted - 03/08/2022 : 08:02:21
@engelbert: I am using my software GeigerLog, which you can download from here: https://sourceforge.net/projects/geigerlog/
Really a single device only? Very strange.
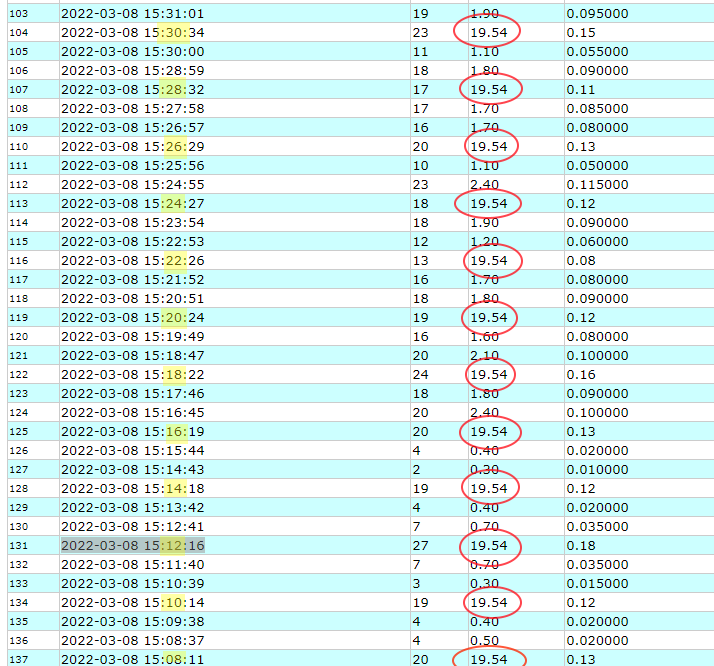
Looking at your last data on the gmcmap site, I see two different sets of data just by looking at the date time:
1 	2022-03-08 15:36:40
2 	2022-03-08 15:36:06
3 	2022-03-08 15:35:06
4 	2022-03-08 15:34:38
5 	2022-03-08 15:34:04
6 	2022-03-08 15:33:03
7 	2022-03-08 15:32:36
8 	2022-03-08 15:32:02
9 	2022-03-08 15:31:01
10 	2022-03-08 15:30:34
11 	2022-03-08 15:30:00
One series ends with seconds in 34...40, the other in 01...06. Some seem like 1 min apart (# 2,3,5,6,...), the others like 2 min apart (#4, 7, 10,...).
By the counter's settings, anything closer than 1 min should be impossible, but there it is (#3 & #4 => 28 sec, ...). From the GMC-320 v5 manual:
quote:
WiFi Data Logging Period
The default data logging period is 2 minutes. This will let unit to log the data to website server every two minute.
User is able to change the period from 1 to any minutes.
Switch your counter off, and see if the entries still come. Maybe someone else is using one or both of your ids?
|
| engelbert |
Posted - 03/08/2022 : 05:44:17
@Ullix,
No, i�m using only one counter a GMC320-v5.
Mayby the settings are not correct.
What for graphic script are you using???
looks very nice.
|
| EmfDev |
Posted - 03/07/2022 : 17:30:40
Maybe there should be an option to set how the ACPM is calculated like over and hour/day/week/since power on.
@Hugo, that looks wrong. Did it just happen naturally like you didnt reset anything since power on? |
| ullix |
Posted - 03/07/2022 : 05:37:03
This WiFi-data thing is sufficiently confusing that I took a closer look. I can say that at least for my counter GMC-500+ the CPM, ACPM, and uSV data as transferred to the gmc.map are indeed as was stated by GQ:
- CPM: the last produced CPM value of the counter
- ACPM: the Total Count of the counter divided by the Total Runtime of the counter, since the Total Count was last reset to zero.
- uSV: the above CPM value multiplied by 0.0065 (GQ's "calibration")
Unfortunately, this does not make the use of these values any more reasonable, the same as said in my Reply #4 is still true.
Doing the measurement is easy with GeigerLog version 1.3. Simply activate the WiFiClient in the GMC mode, and record the data via WiFi. Unfortunately this latter part is quite a bit more demanding due to "features" in the GMC-500 firmware :-(. For details see the GeigerLog manual.
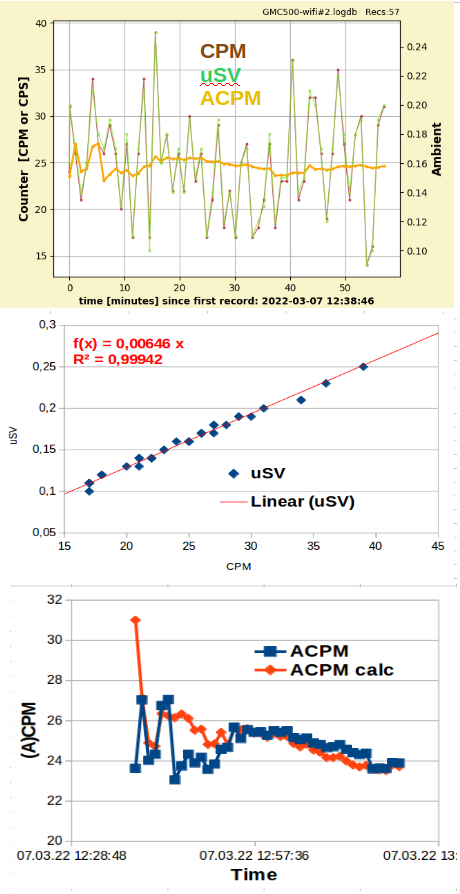
The upper picture shows the GeigerLog run. Counts are on the left y-axis, uSV on the right y-axis. The ACPM, for the most part, overlap the CPM data.
A scatter plot of uSV vs. CPM gives a clear relationship with a slope of 0.00646. The difference to the "true" factor 0.0065 is probably due the truncation of the WiFi data to 2 decimals.
So, both CPM and uSV are single measurement point values; no average of anything.
The bottom pic shows a comparison of the ACPM as uploaded, and an ACPM-calculated from the above CPM and the time. They are a bit different initial, but then converge. The initial difference may well be due to the uncertainty of timing in the resetting of the total count and the starting of GeigerLog, which are separate, manual activities.
I repeat myself, but this does not make sense. Governmental monitoring sites present hourly averages and daily averages. This is more enough for time resolution. One-minute values are simply not useful. And neither are averages taken over anything from minutes to weeks, or even longer!
|
| Hugo |
Posted - 03/06/2022 : 10:44:46
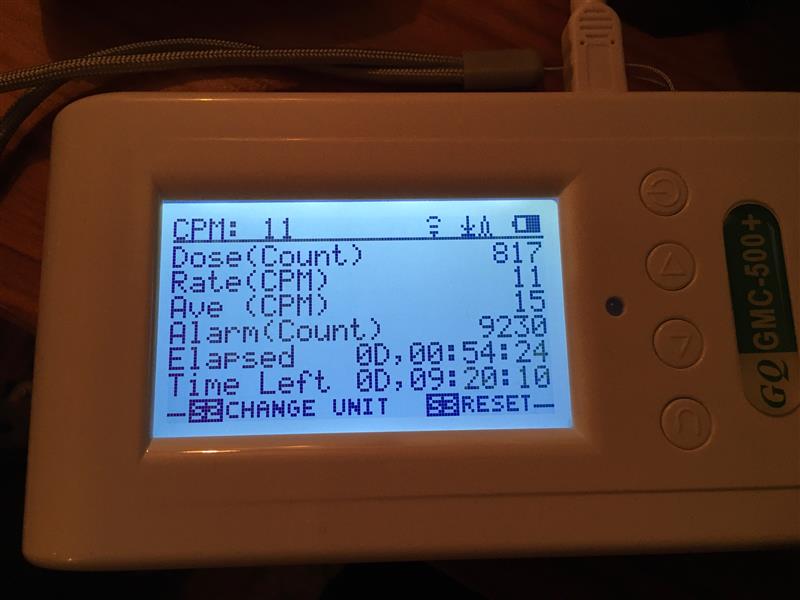
Interestingly the 'Dosimeter' view seems to have a more appropriate ACPM?
 |
| Hugo |
Posted - 03/06/2022 : 10:34:56
I'm afraid I'm not understanding the ACPM calculation either: 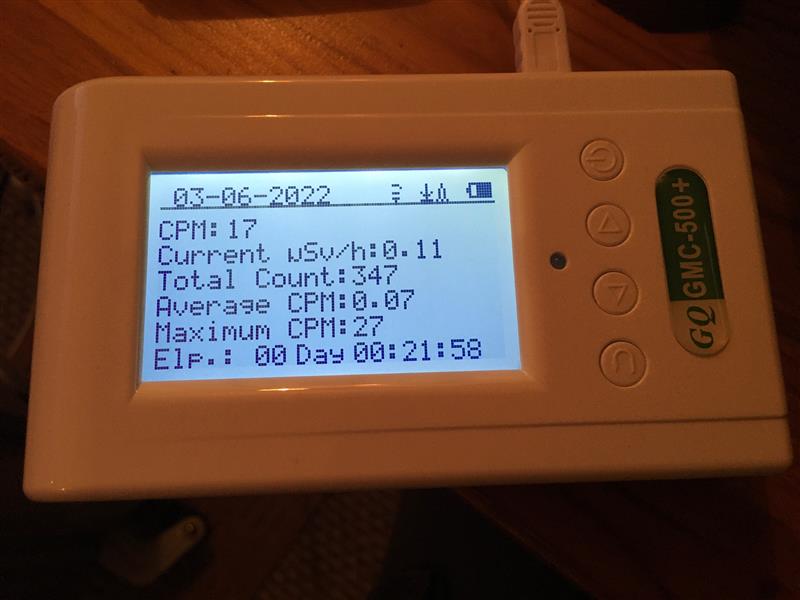
The device has been running for 21:58 seconds (let's call that 22 minutes) and has total count of 347, my basic maths says that's a 347/22 which should give an ACPM of 15.77 but the ACPM is showing 0.07? |
| EmfDev |
Posted - 03/03/2022 : 11:41:35
It would be better if the ACPM can be dynamically calculated depending on an event, but currently the device ACPM is calculated with total count since power on. User can reset the total count or used different mode like timed count to measure ACPM of a certain area / event.
For the graph, it might need more time to really see that ACPM becomes more stable. And the yellow graph might be caused by decimal accuracy? |
| ullix |
Posted - 03/03/2022 : 04:47:03
quote:
ACPM = total_count / ( (minutes) + (seconds / 60)
If this were indeed the used formula, it would be really bad! Because it becomes insensitive to changes the longer it runs.
Let's look at a - purely fictitious - scenario: the counter is run in the Netherlands at background for a month, and the total count is 1 million, which gives ACPM = 1 Million / (30*24*60) min = 23.15.
Now some mad president of a nuclear power country decides to drop an atomic bomb on a country, let's call it Ukraine. The background in the Netherlands jumps up to CPM=1000. An hour later your total count is 1001000, and your ACPM=23.17.
Conclusion: not different from average; nothing has happened. While in reality the countrate has increased nearly 50 fold!
You can't use that formula. ACPM needs to be calculated over a given period of time, which is determines by the time-resolution you want. Governmental sites may use hourly averages, which they may even reduce to daily averages at the end of the day. I suggest to not overdo it and use hourly averages as ACPM.
However, I doubt that formula is indeed applied.
I took the last data page from @engelbert, to which he had linked, from the gmcmap and plotted CPM, ACPM, uSv over time:
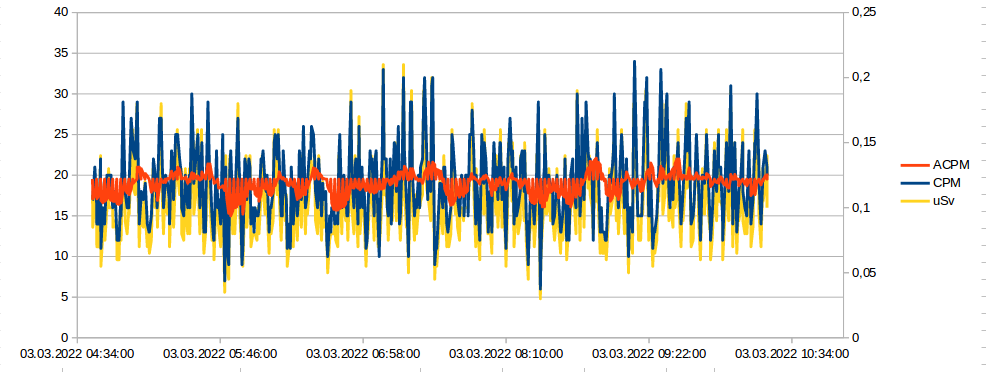
Blue is CPM and shows the expected scatter. Red is ACPM. Its scatter should shrink over time, but it rather does look as if it were averaging over not more than the last 10 (20?) minutes.
More strangeness: Yellow is uSv (actually should be: uSv/h), and as it is calculated from blue by multiplying with a factor, blue should completely and exactly cover yellow. Which it does not do.
Plotting blue vs yellow should give a straight line with the slope of Sensitivity=154. But look what I get:
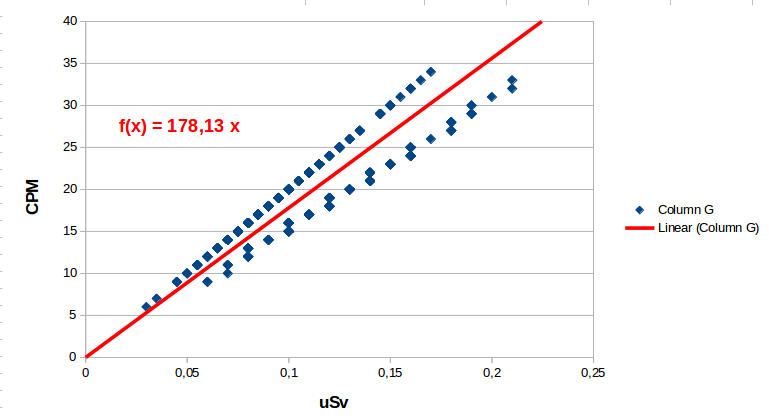
This looks like 2 distinct series of data. The lower data set might have the Sensitivity 154, the upper one is closer to 200.
@engelbert: are you by any chance using 2 different counters under the same login?
If not, this is a miracle which needs explanation.
|
| EmfDev |
Posted - 03/02/2022 : 11:29:17
Hi @ullix, the calculation long time ago was every minute. But it has been changed to every second.
ACPM = total_count / ( (minutes) + (seconds / 60).
|
| ullix |
Posted - 03/02/2022 : 01:27:28
@EmfDev: What is the period over which this average is calculated? Is it like "last X minutes"? Does it depend on the update period set at the counter?
The CPM value uploaded is always the last measured CPM value, correct?
|
| EmfDev |
Posted - 03/01/2022 : 18:21:13
It is average CPM from your device. |