| T O P I C R E V I E W |
| Stargazer 40 |
Posted - 08/27/2019 : 05:37:15
In November of last year I made an effort to assess dead time delay and conversion factors for 500+, 600 and 600+ GMC meters. That post is here:
https://www.gqelectronicsllc.com/forum/topic.asp?TOPIC_ID=5554
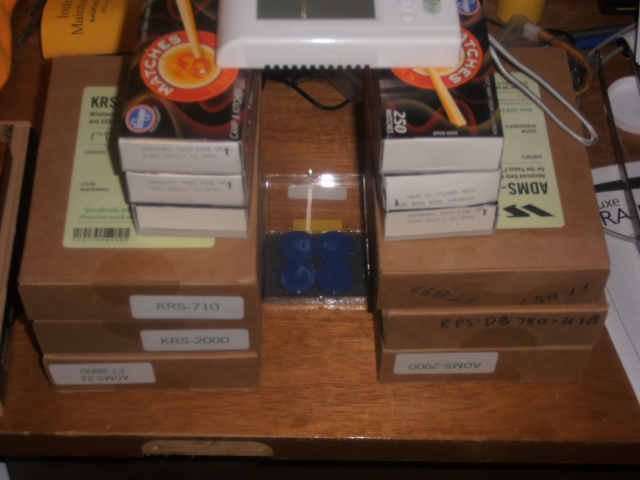
Please review posts #1 and #2 to see the basic setup. The measurements were direct readings after a brief time of stabilization of counts and the assumption was made that the meters remained in the plateau region of the voltage applied to the tube.
With the ability now to hold the voltage constant at a preset level and greatly improve the statistics of the counts using the Timed Count function of the meter I have begun anew to get to better numbers for conversion factors and dead time delay.
Even the best GM tubes have a slope to the GM plateau region. For the 7317 that's 10% per 100v. What that means to me is that at a higher voltage the tube becomes more efficient at recovery after a detection event and dead time delay is reduced. We see more of the actual counts and therefore the estimated counts from the dead time equation would be too high unless we adjust the dead time delay. It needs to be reduced. The overall effect of the stabilizing the voltage brings more consistency to the readings and improves our confidence in the measurements. It also makes the device calibratable across a broader range.
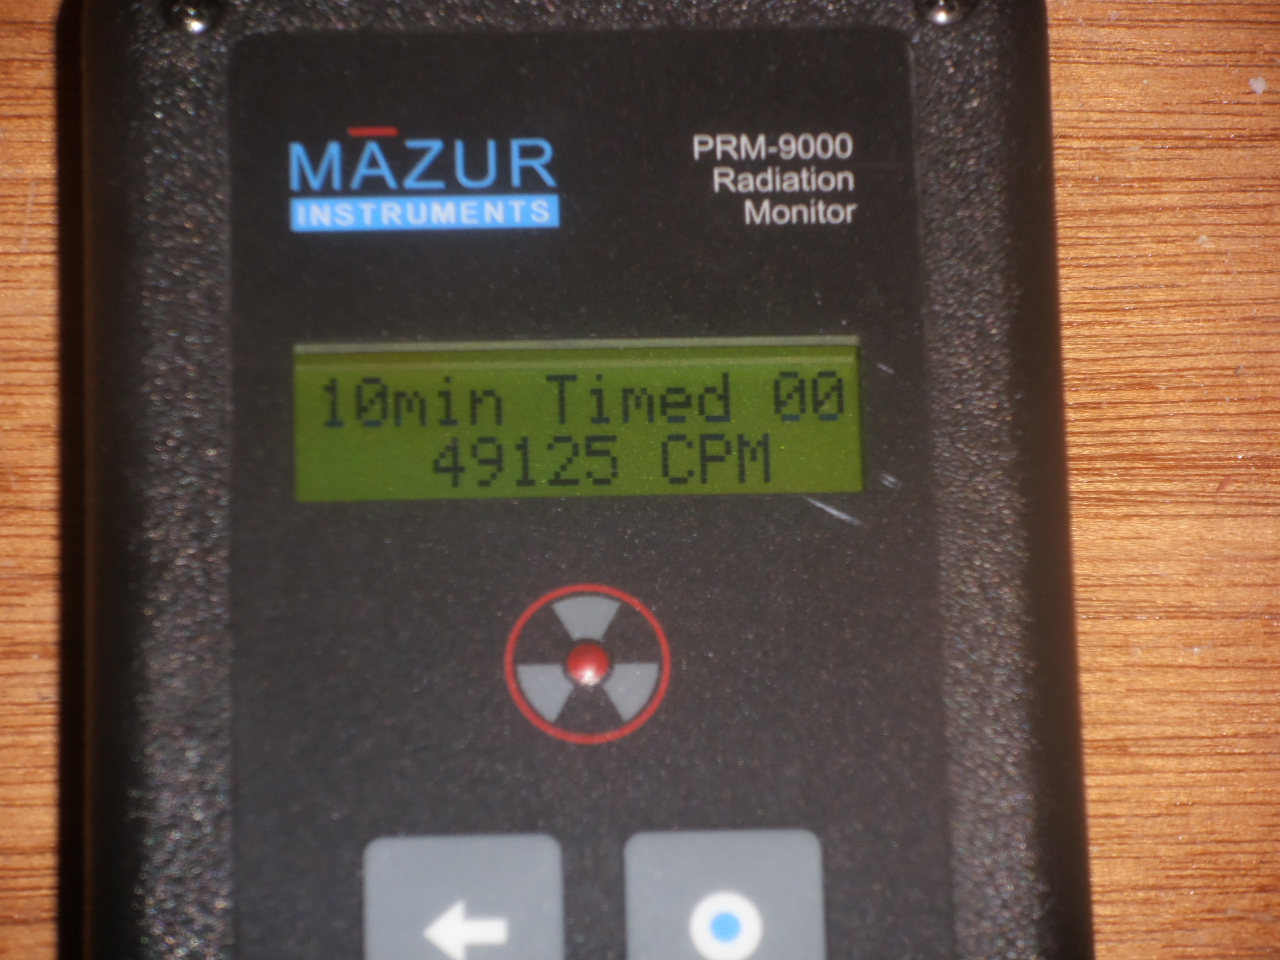
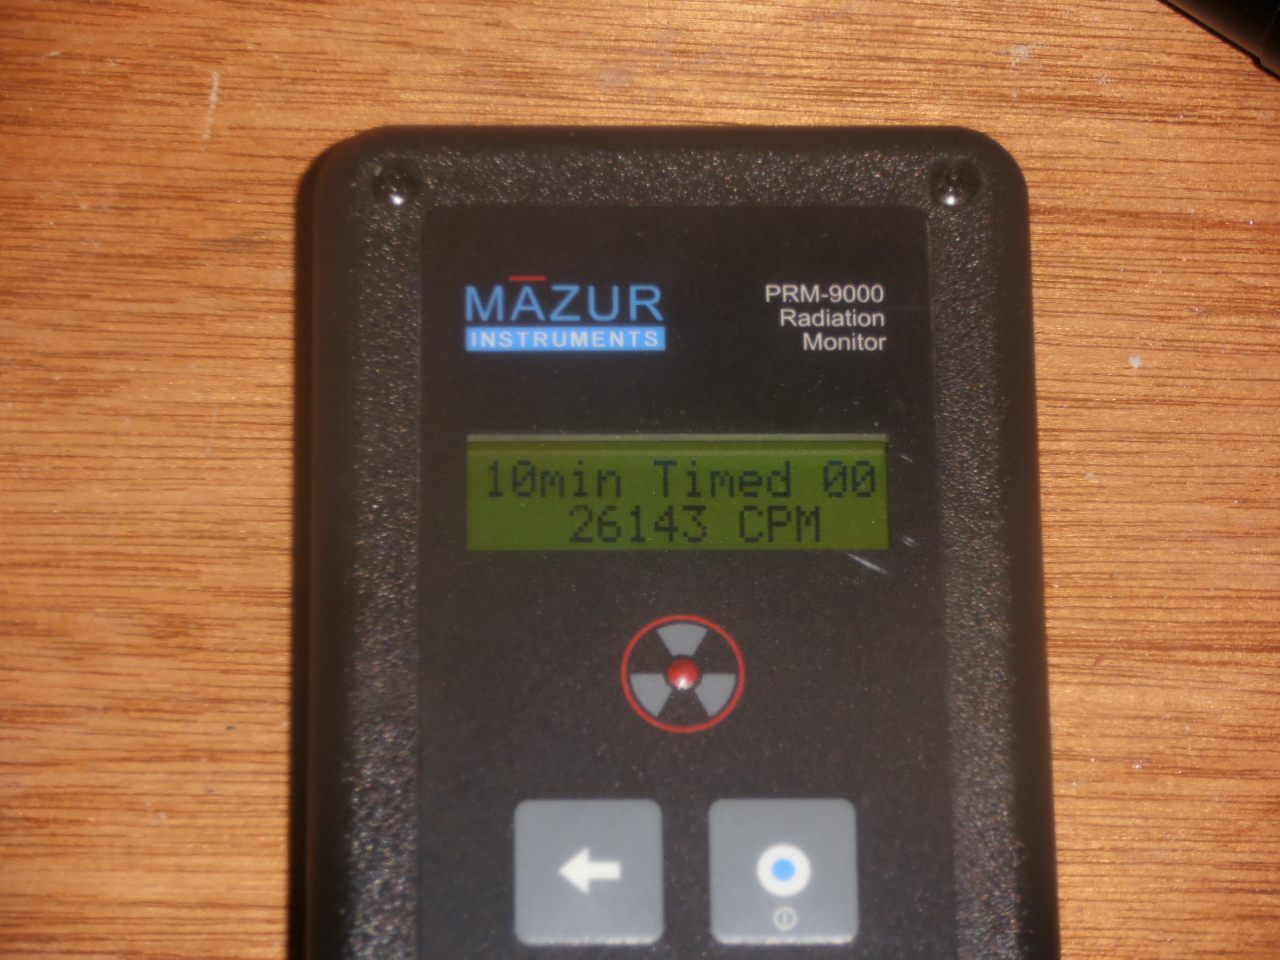
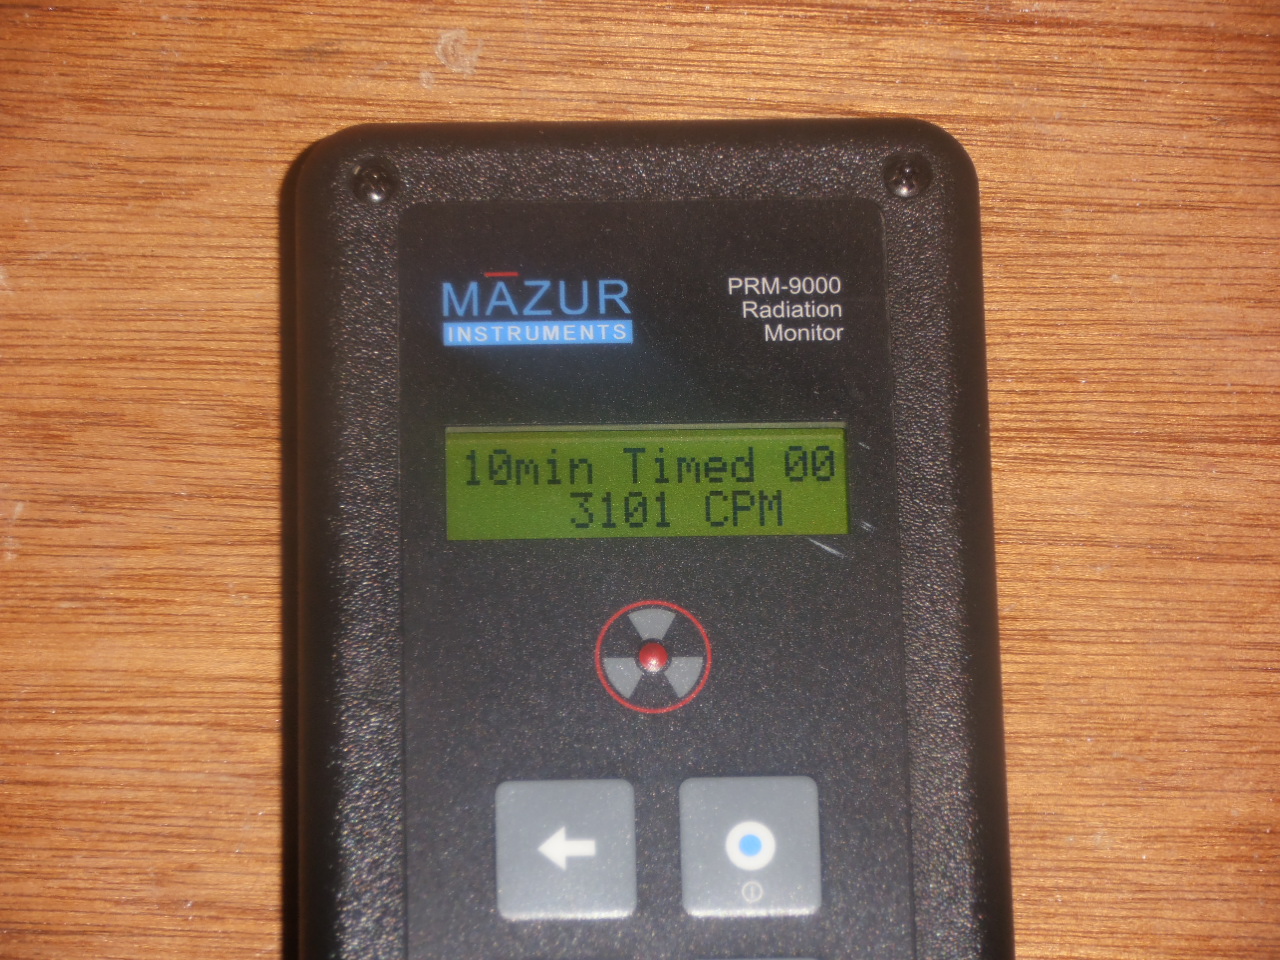
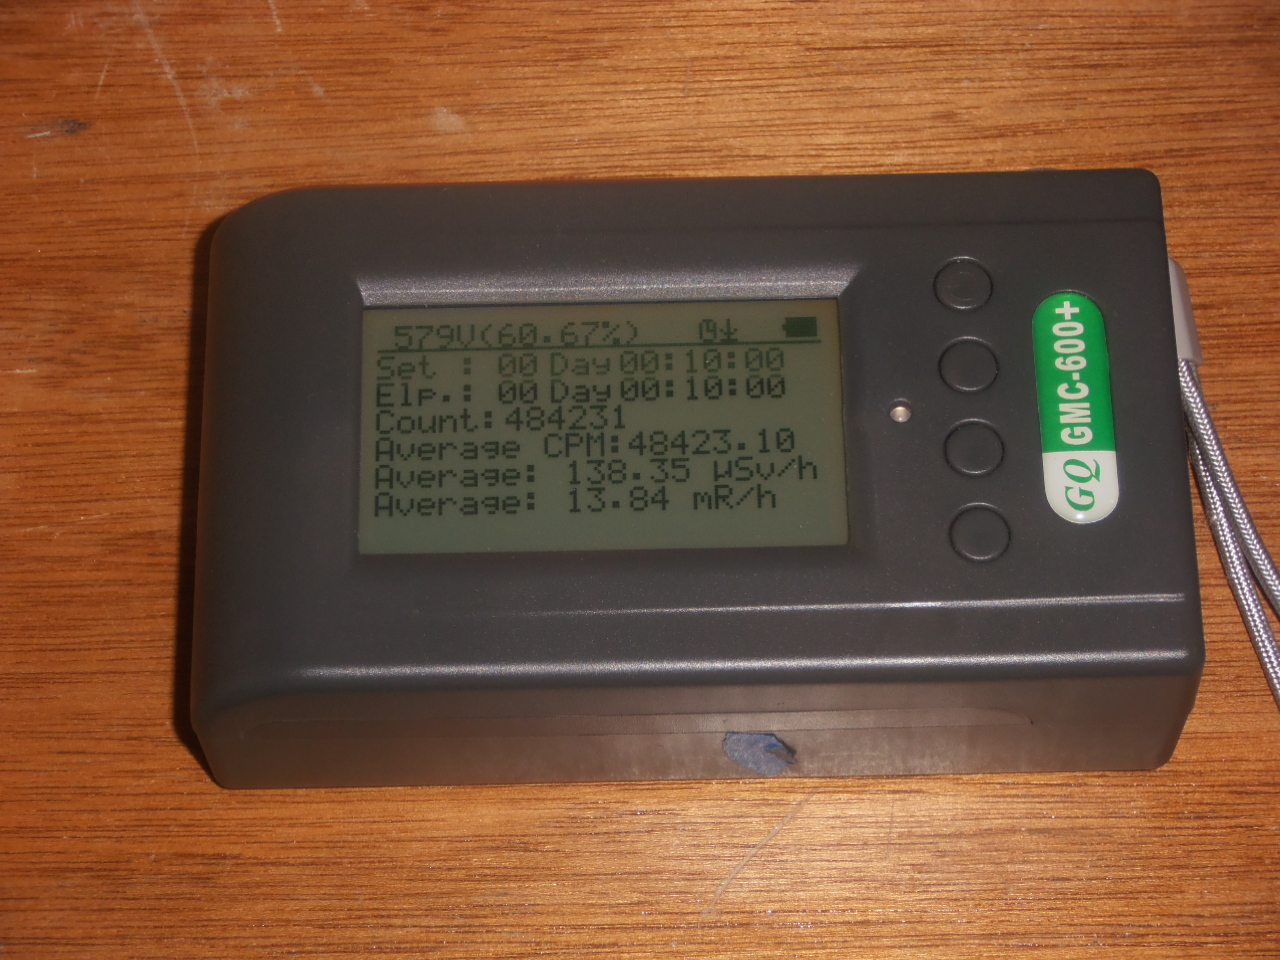
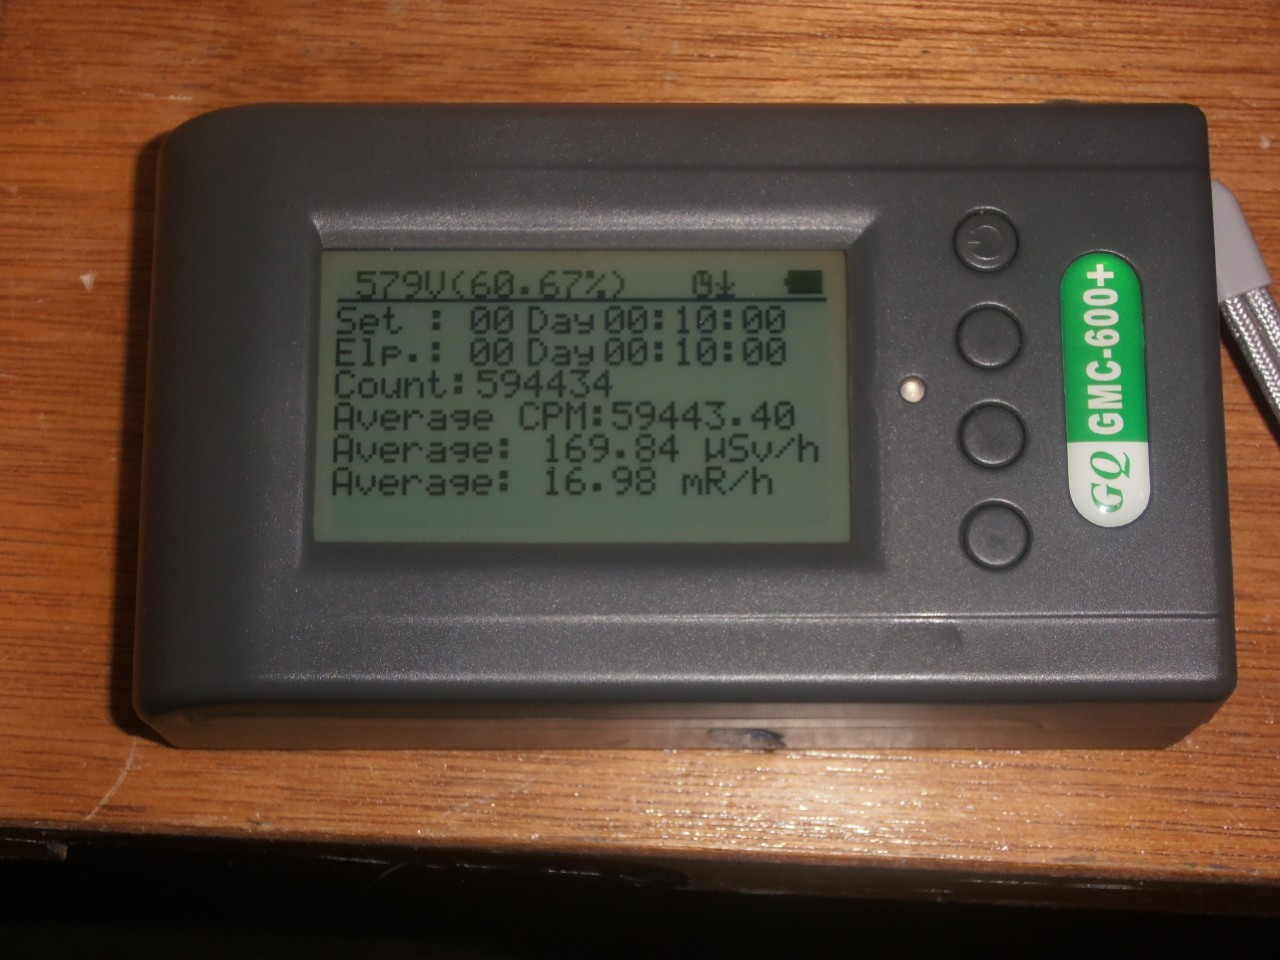
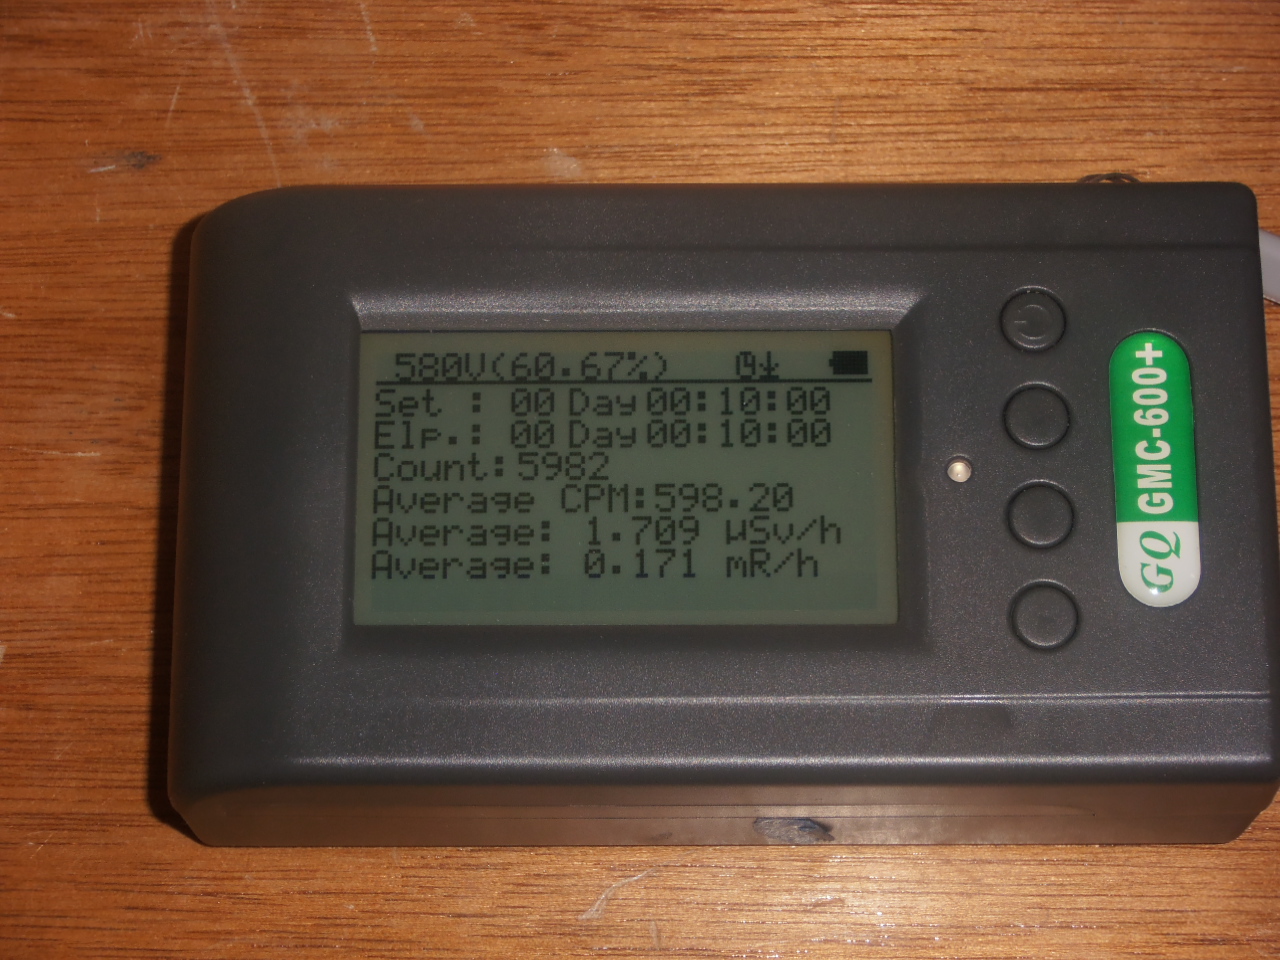
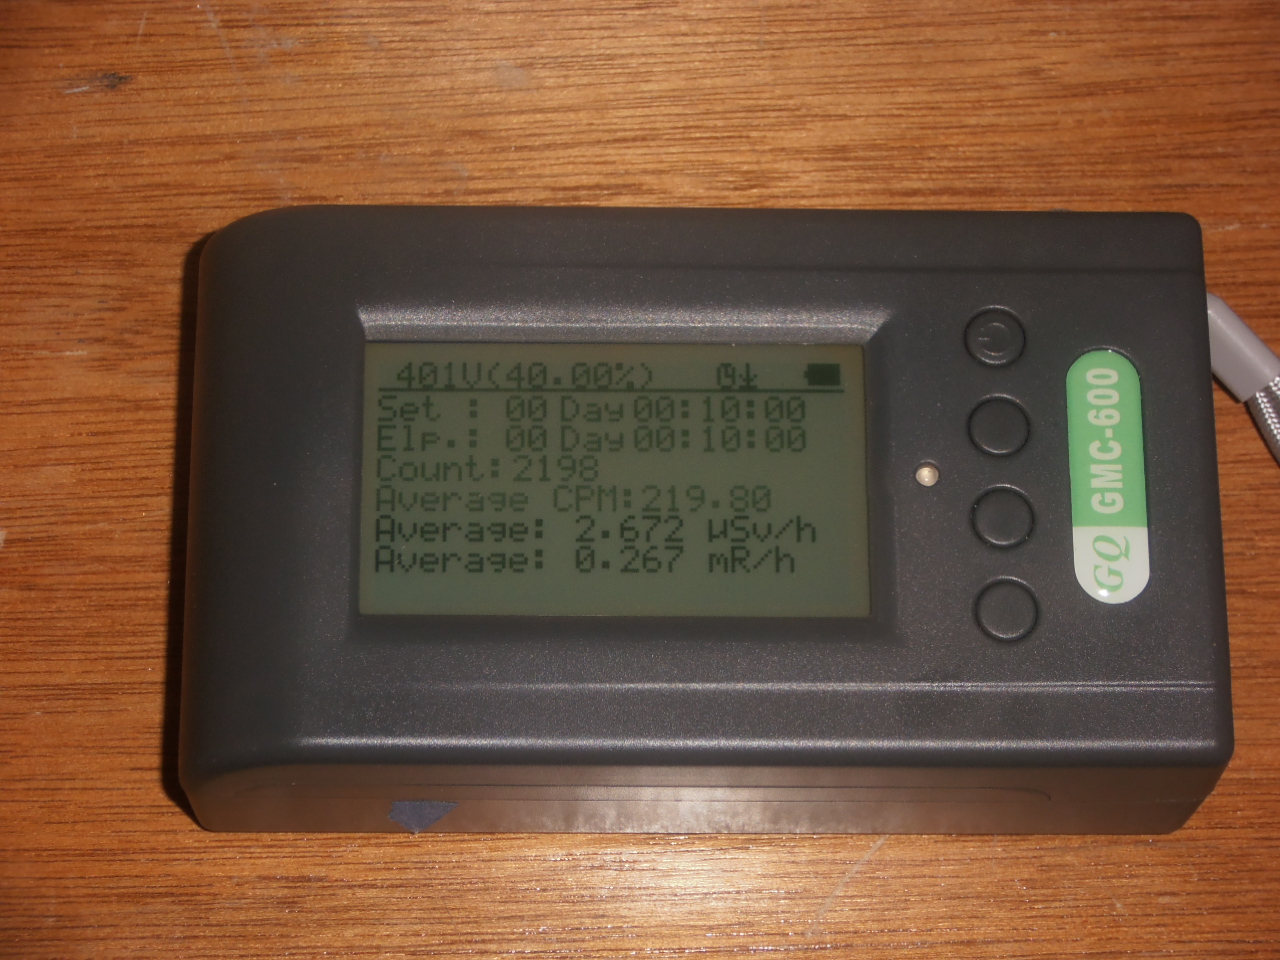
I borrowed my friend's Mazur 9000 again to compare. This meter has gone through laboratory calibration and provides a great check on whether we have dead time delay properly estimated. Previously we had used a dead time delay of 270usec. However the voltage applied to the GM tube was near the top of its working range (475-675V) to insure we stayed in the plateau region at high count voltage drops. Currently GQ is sending the meters out at ~575V or near the middle. For the tests I've done for this post with the Auto Voltage Adjustment turned on, the dead time delay needed to be increased to 300 usec to match reading of the Mazur 9000 (increase expected because voltage lower).
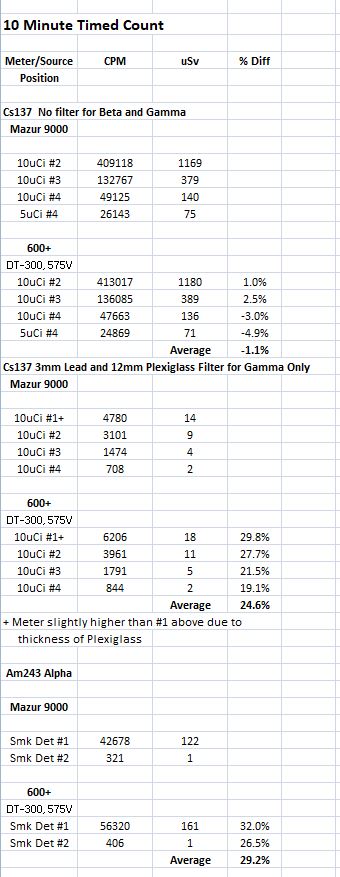
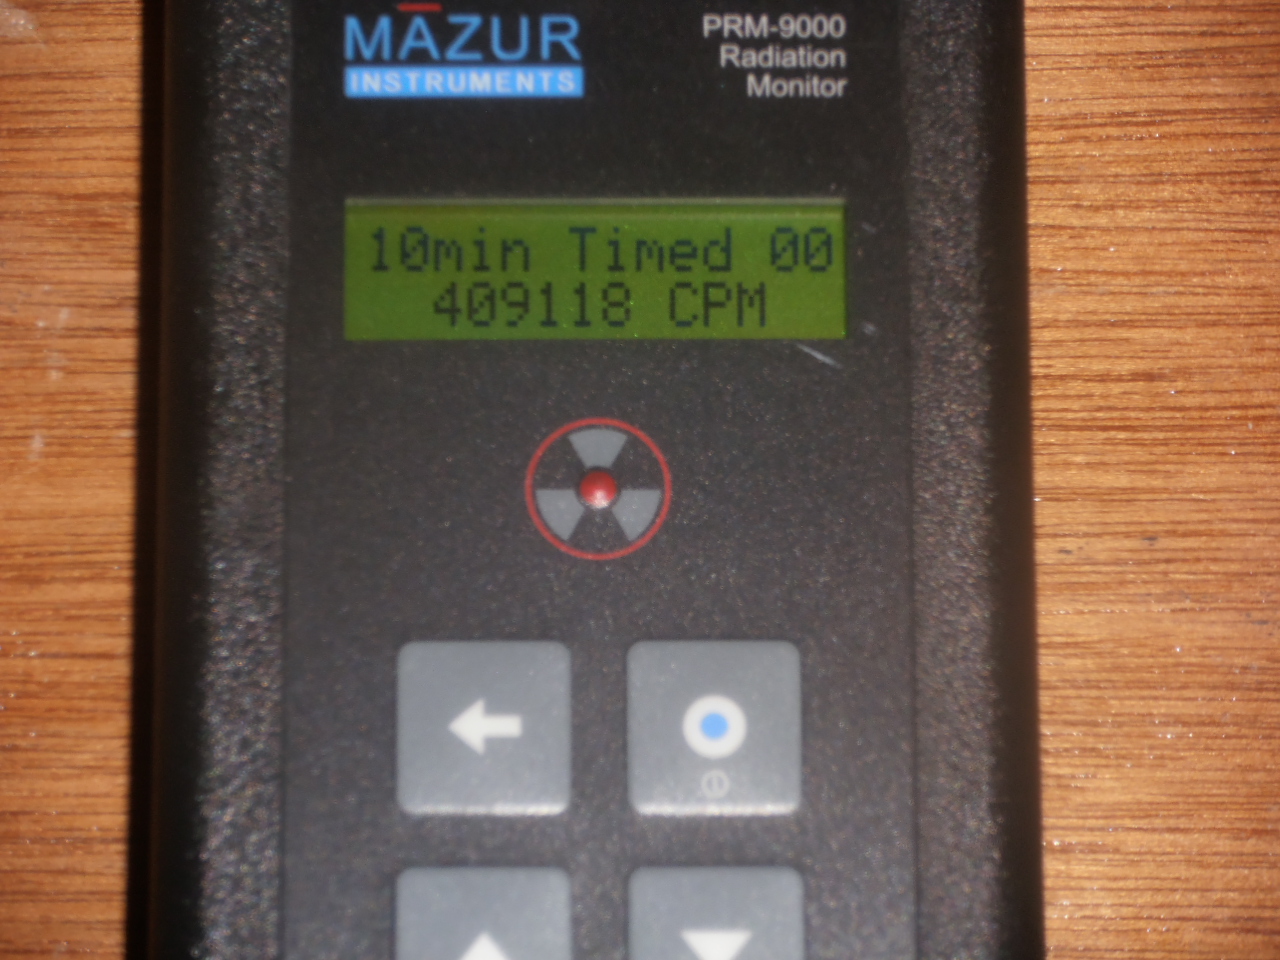
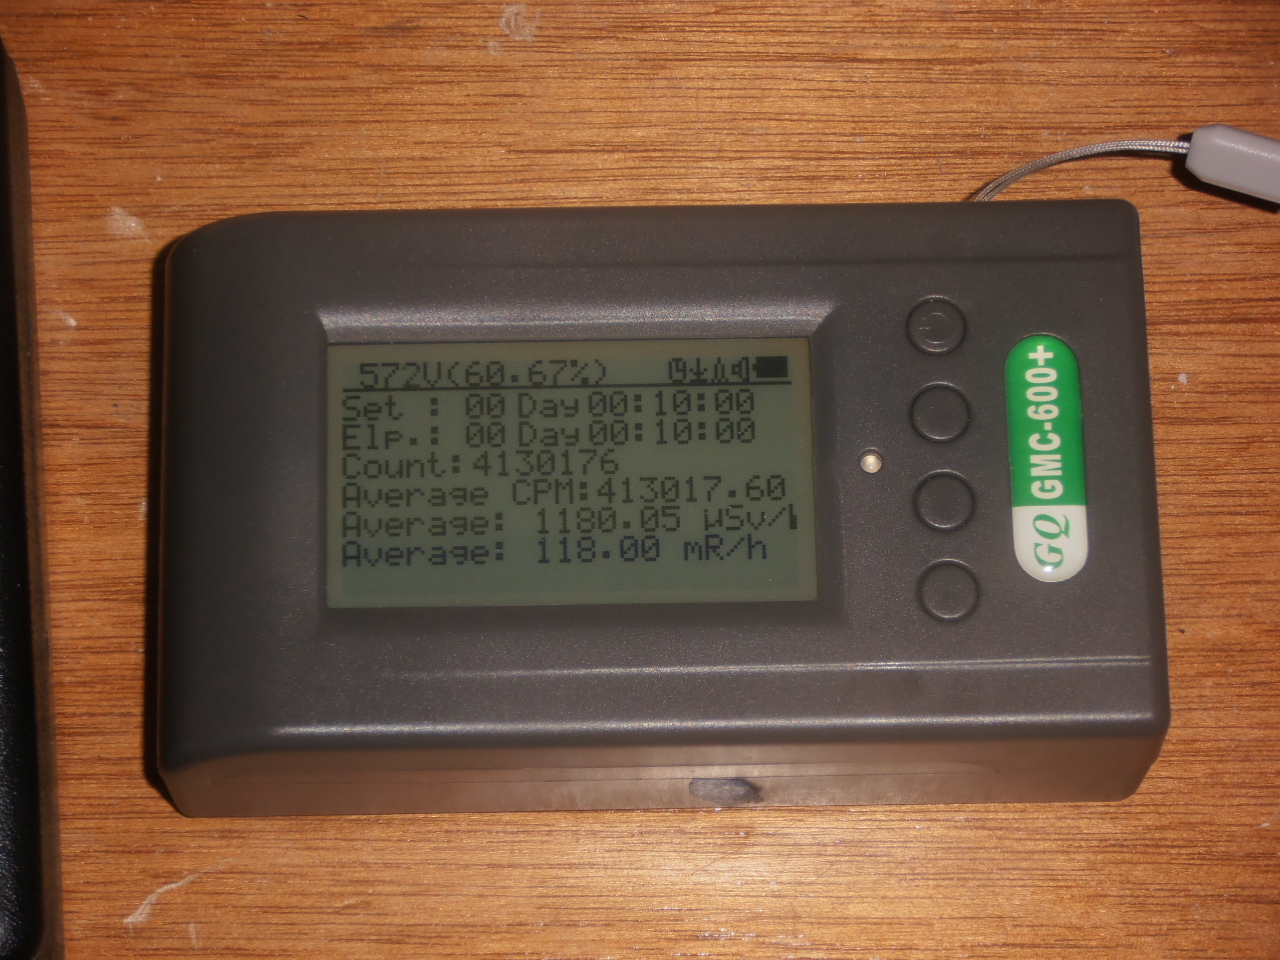
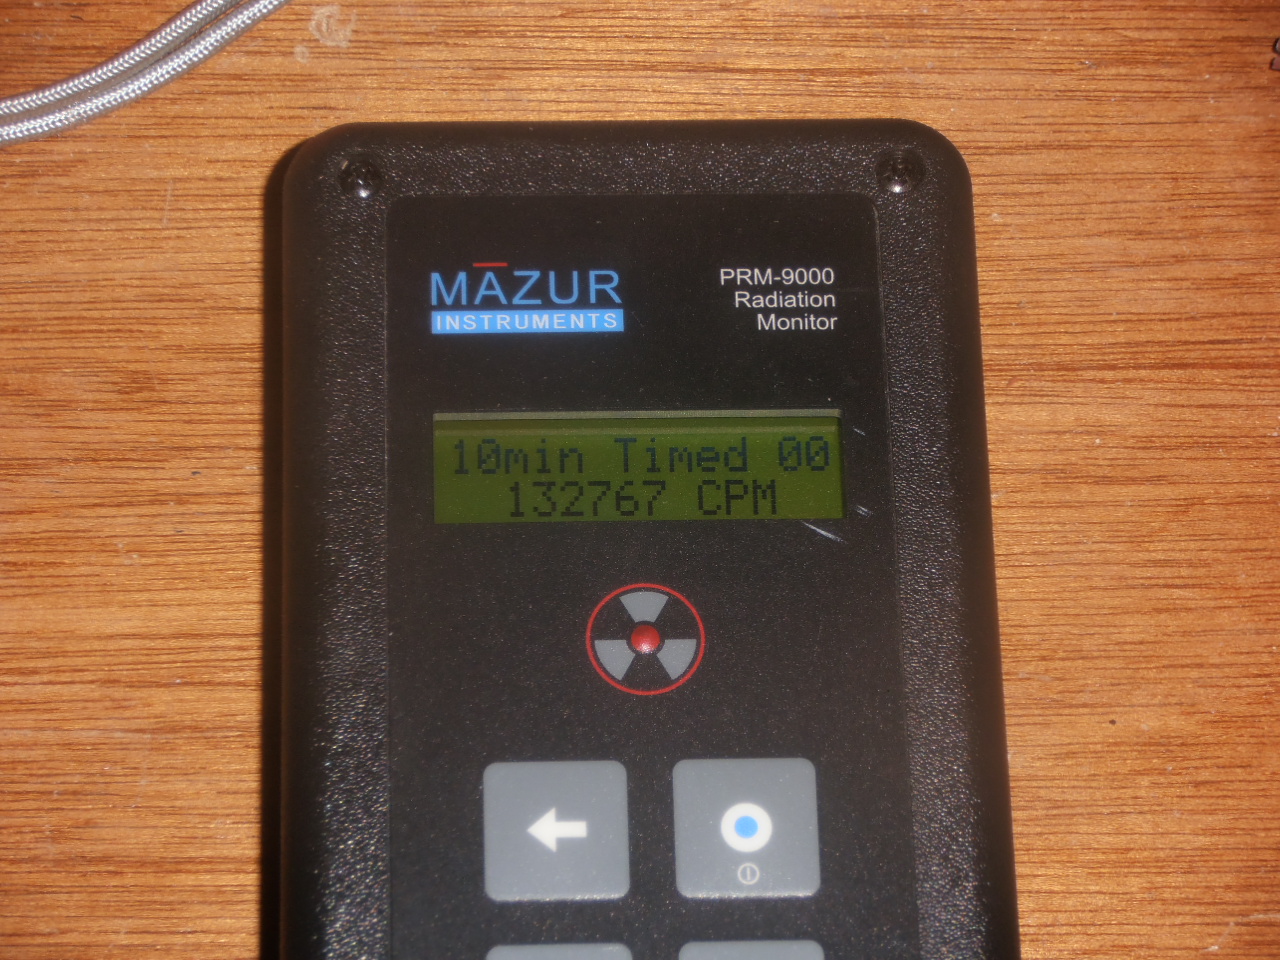
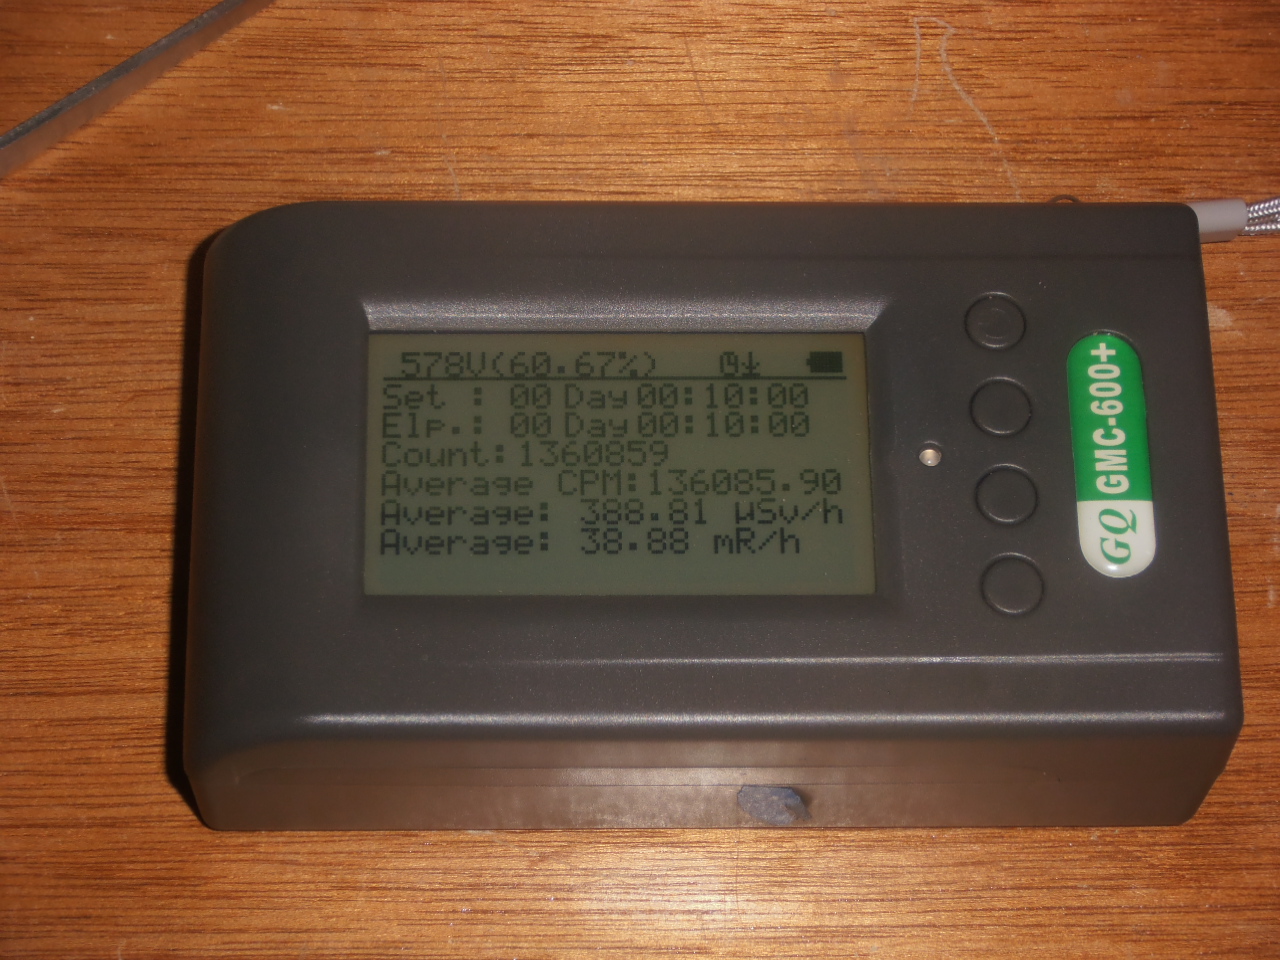
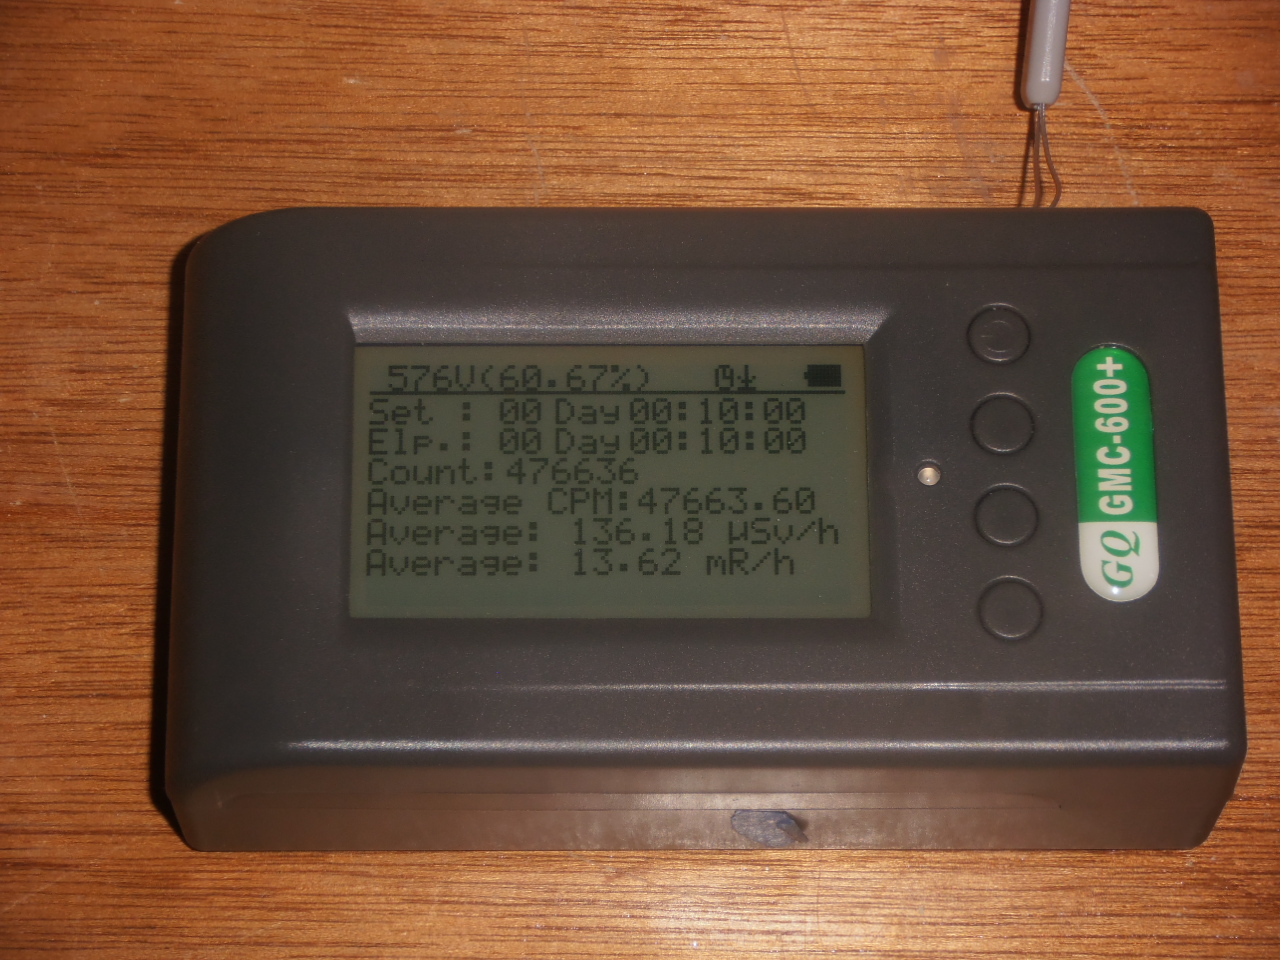
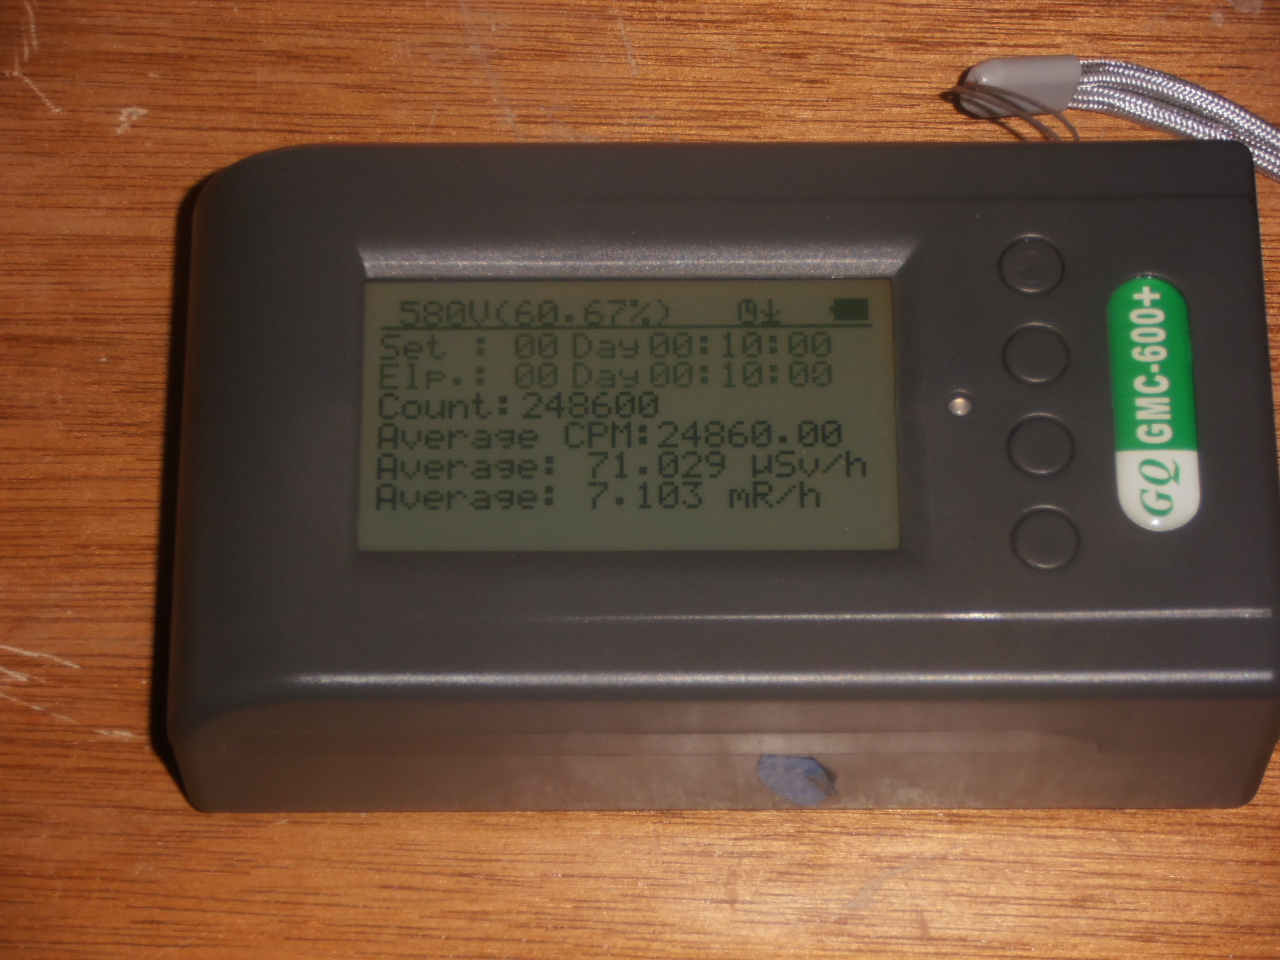
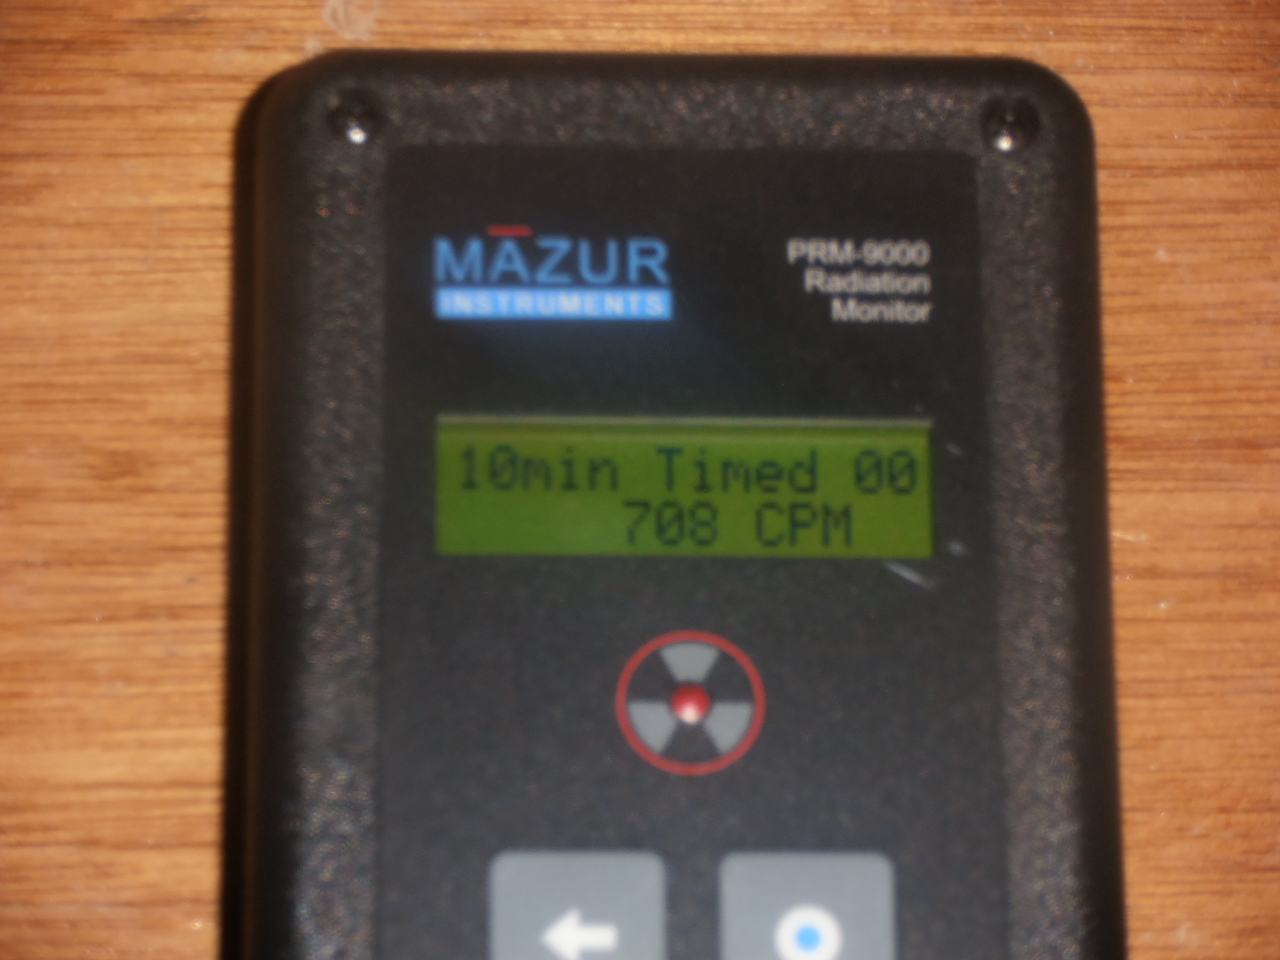
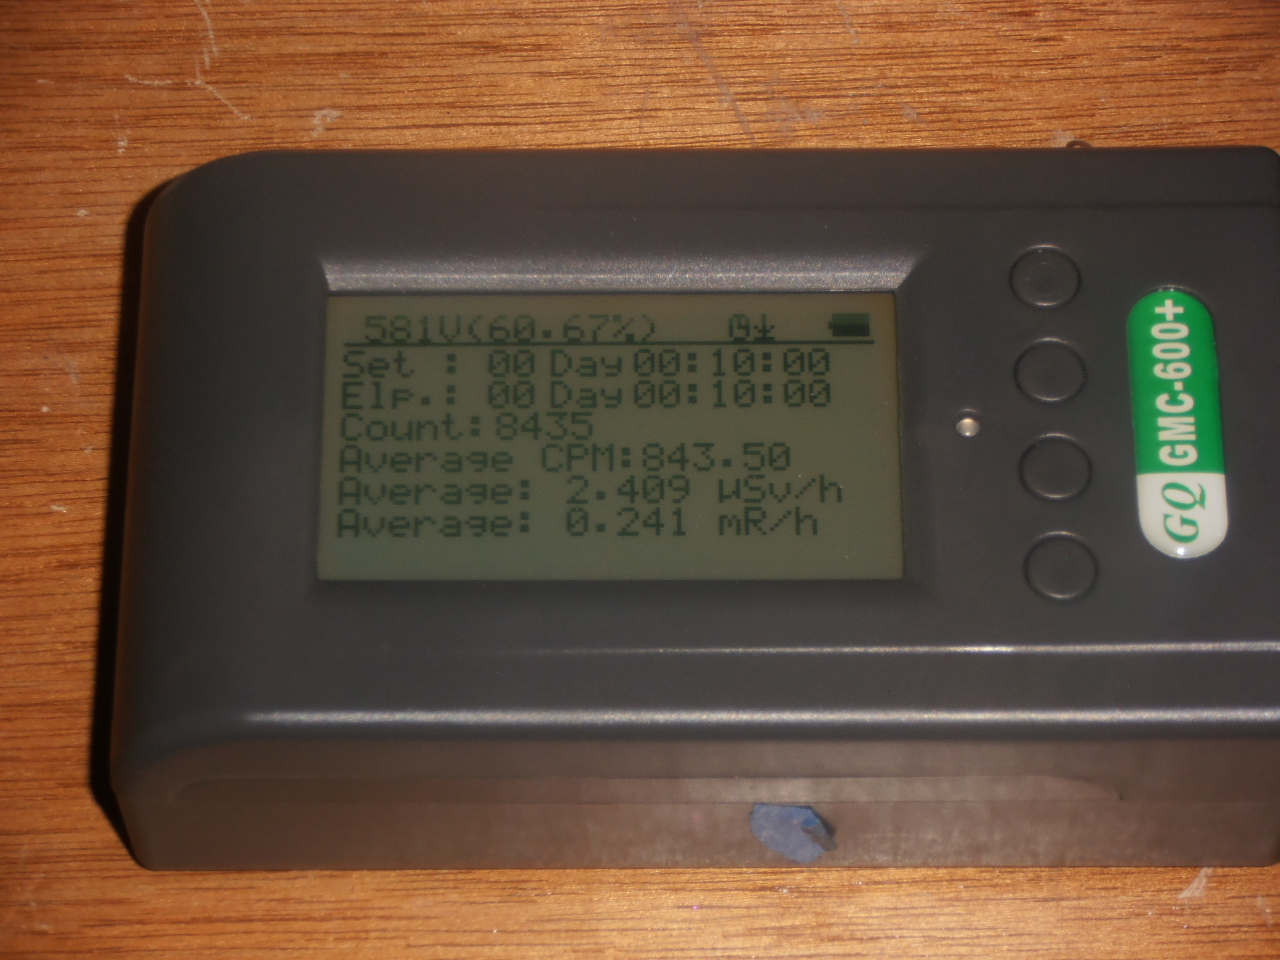
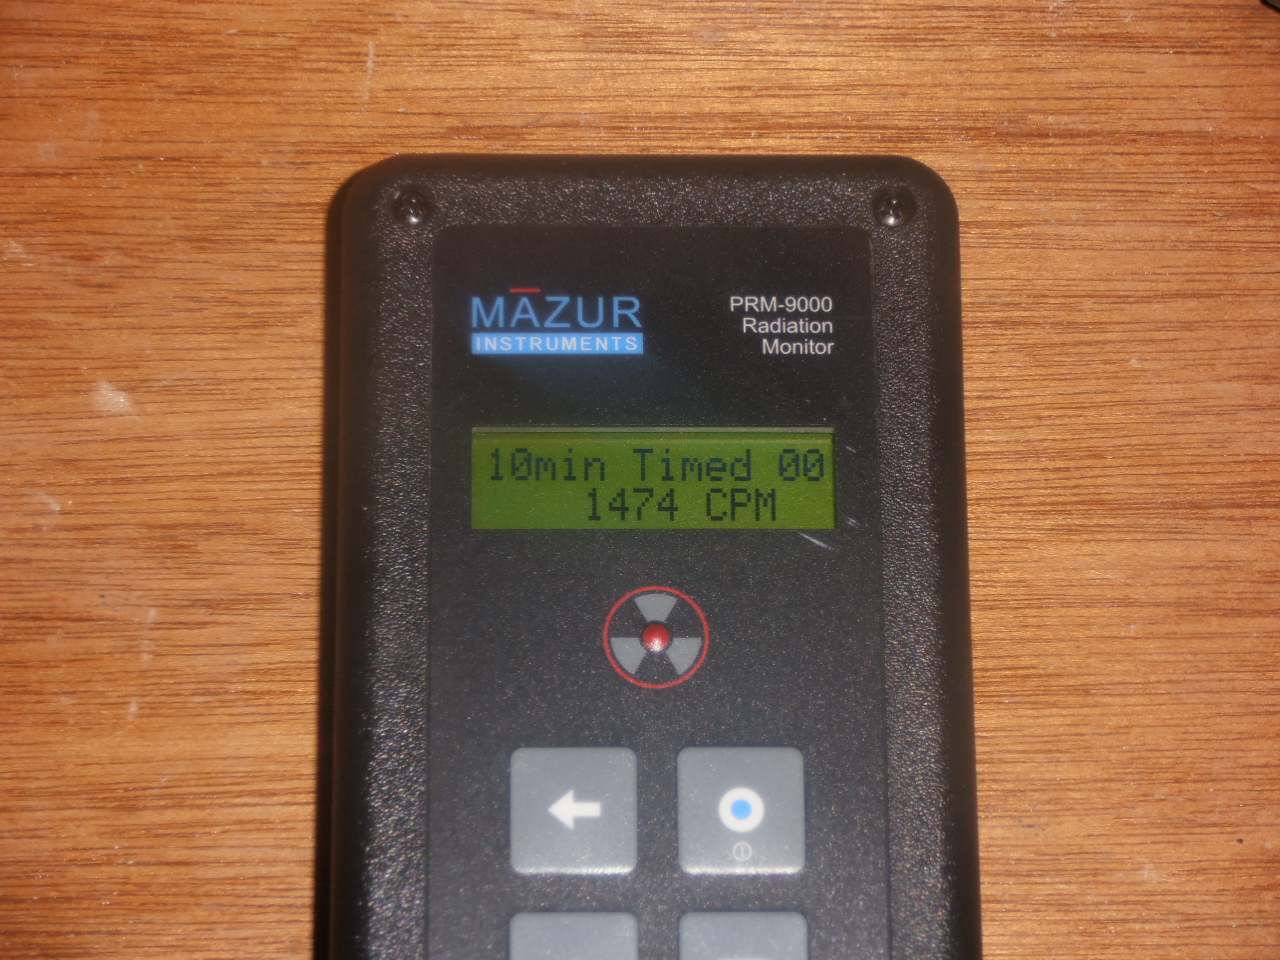
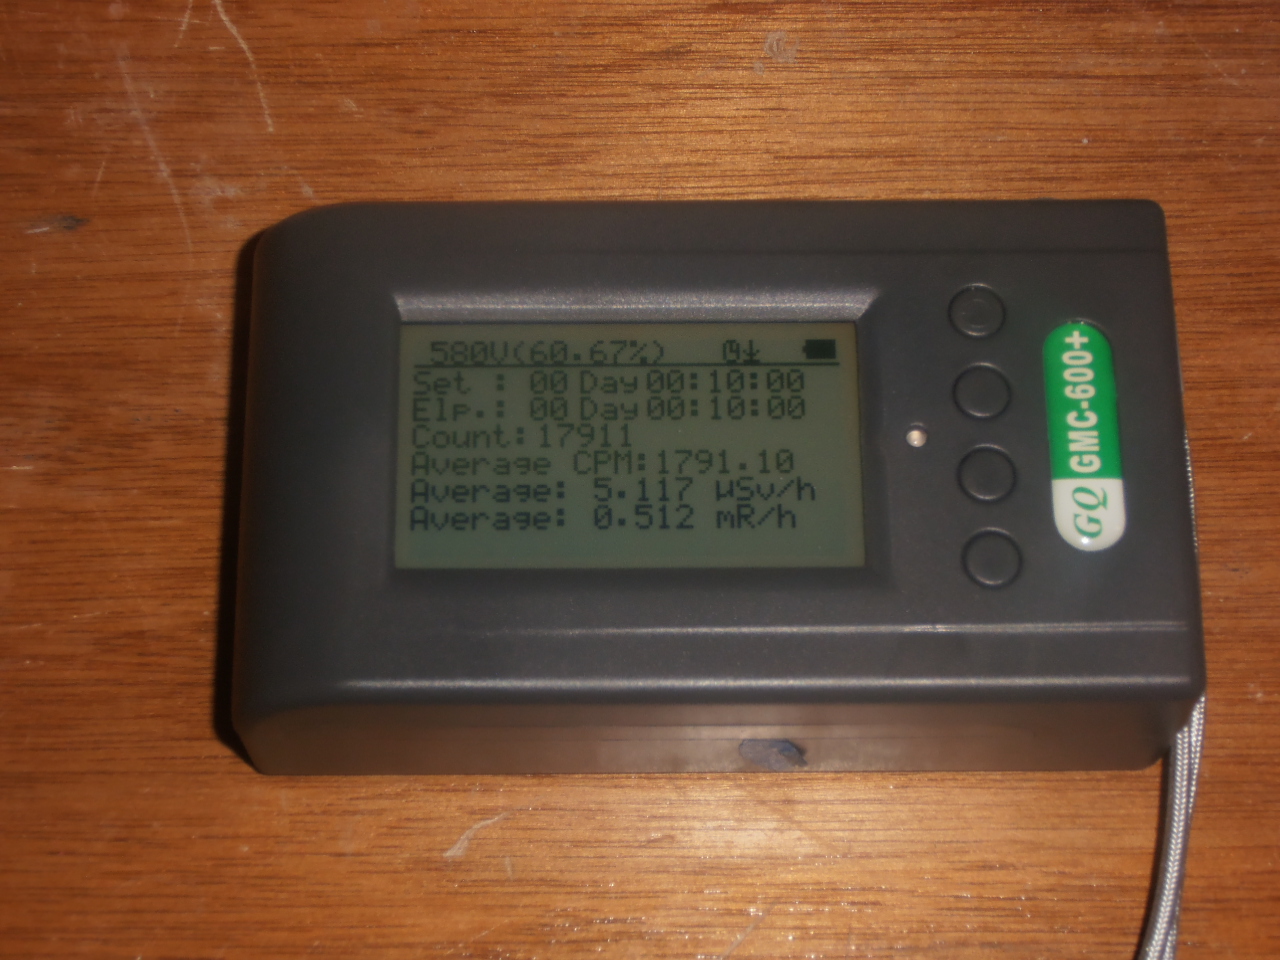
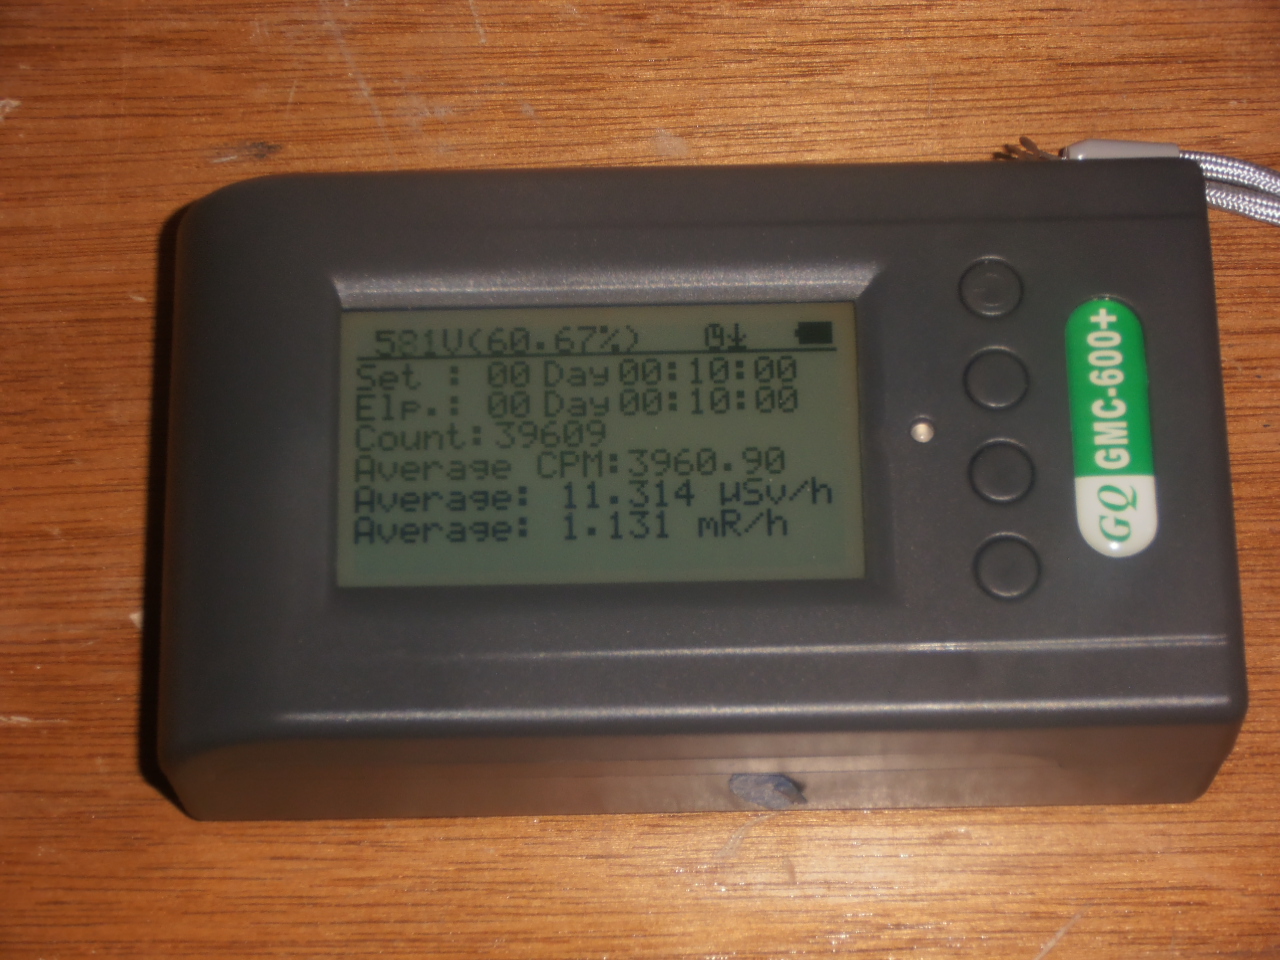
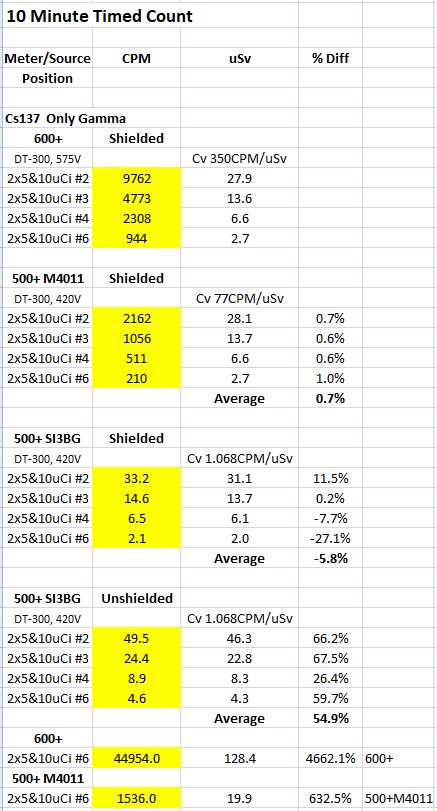
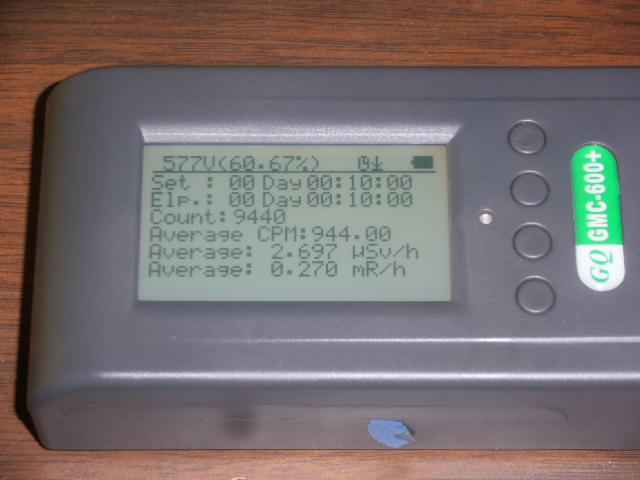
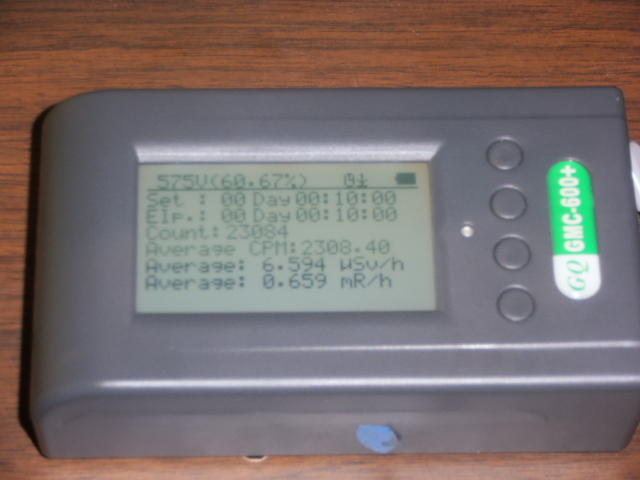
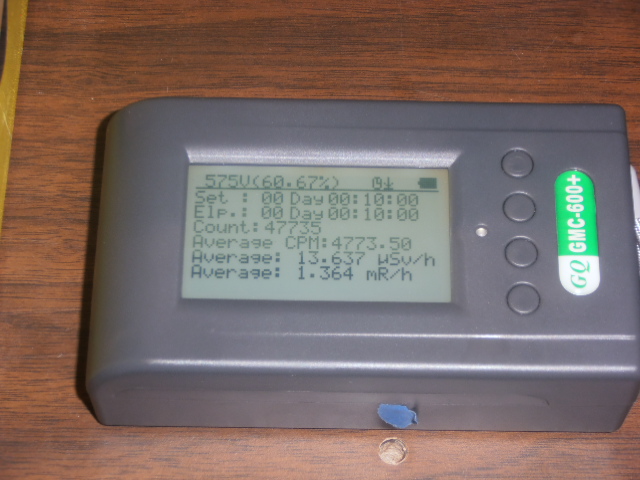
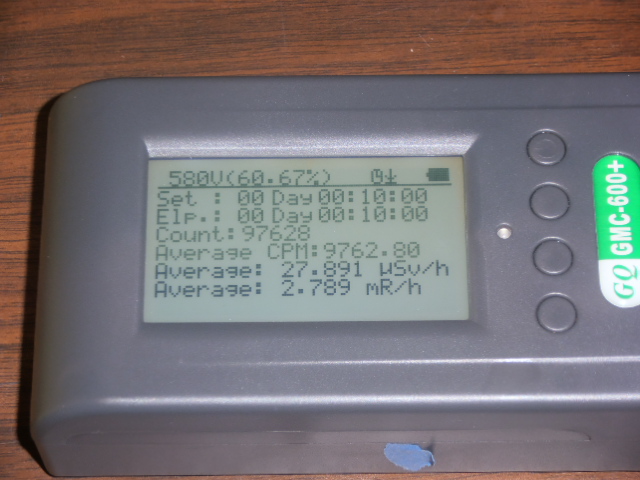
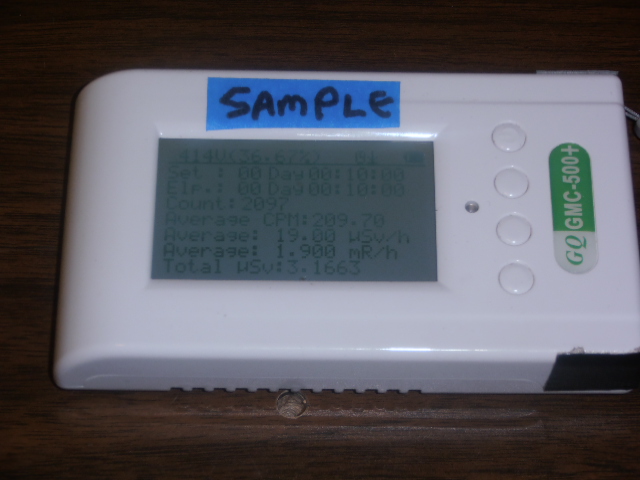
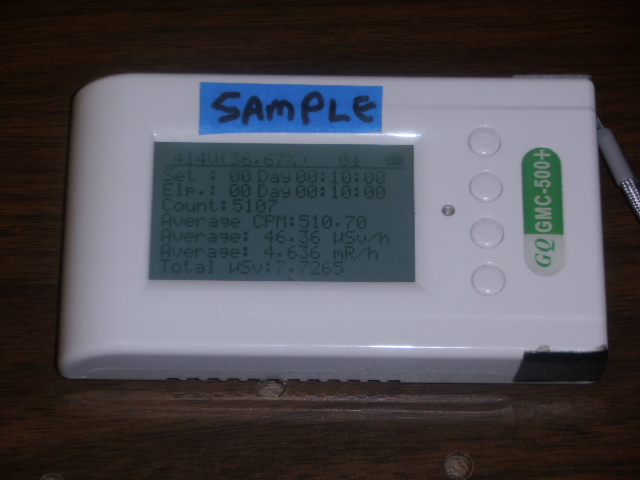
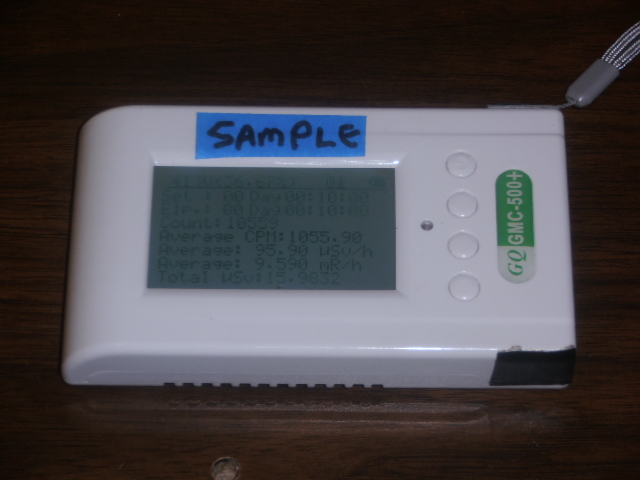
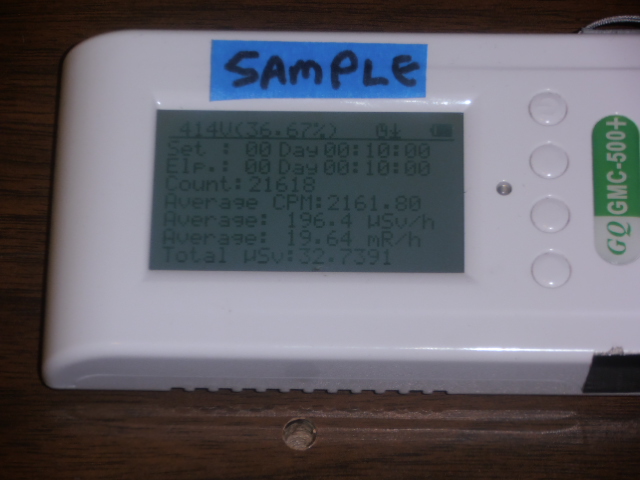
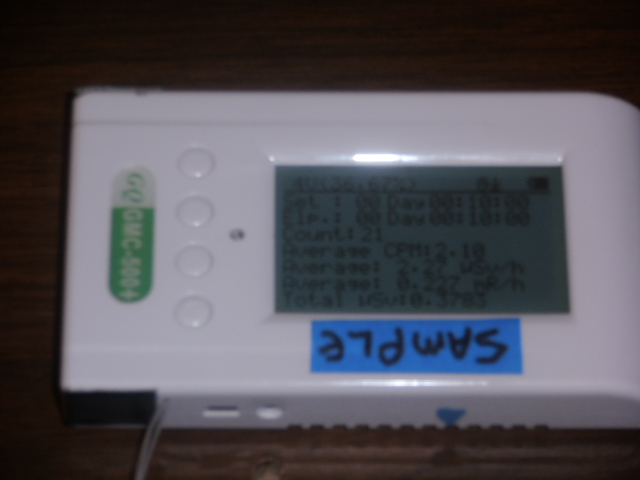
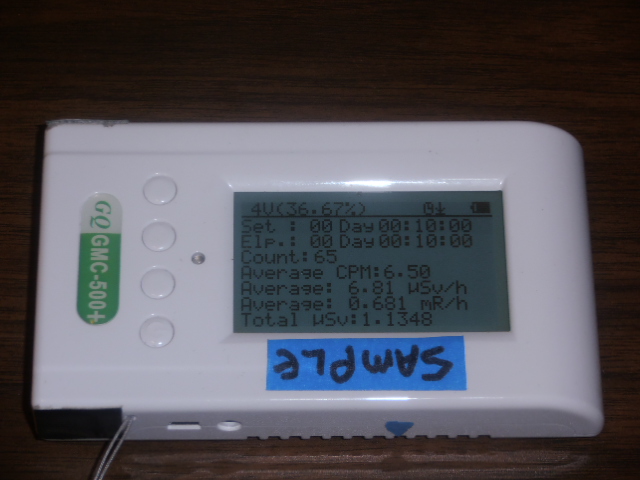
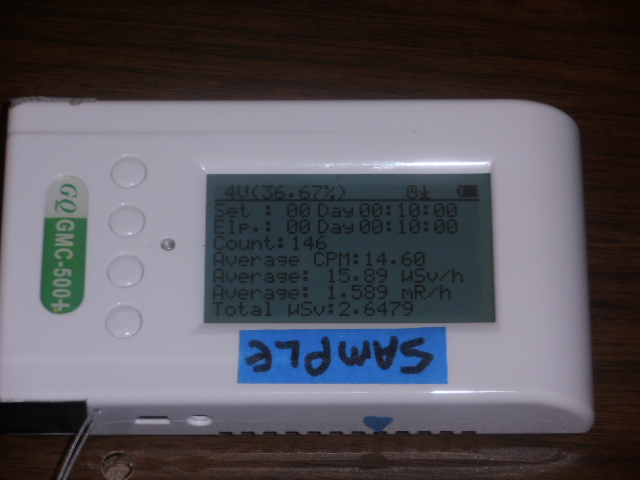
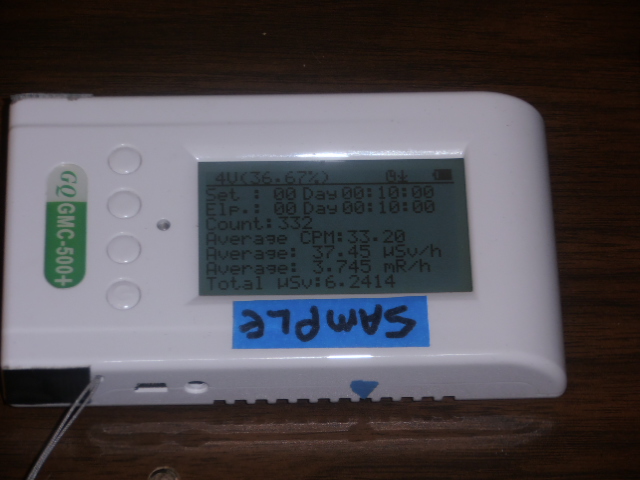
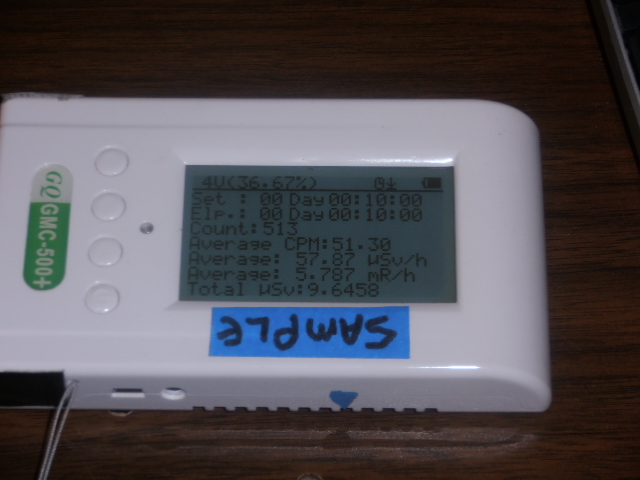
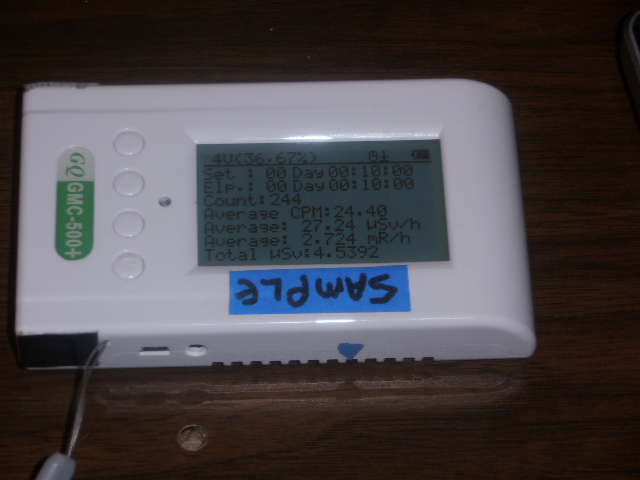
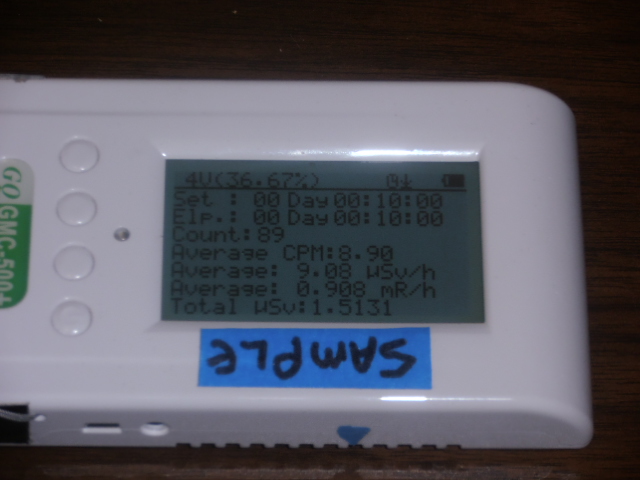
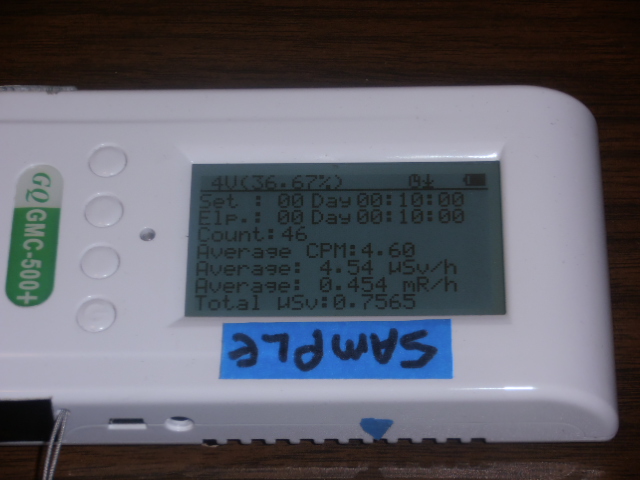
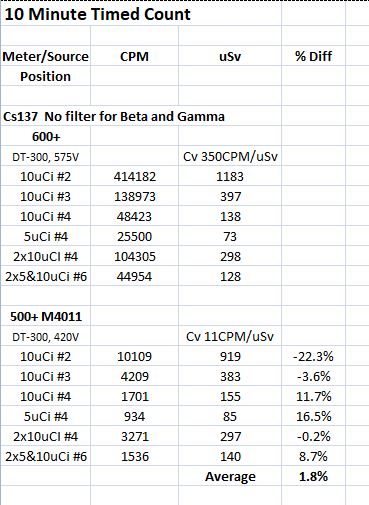
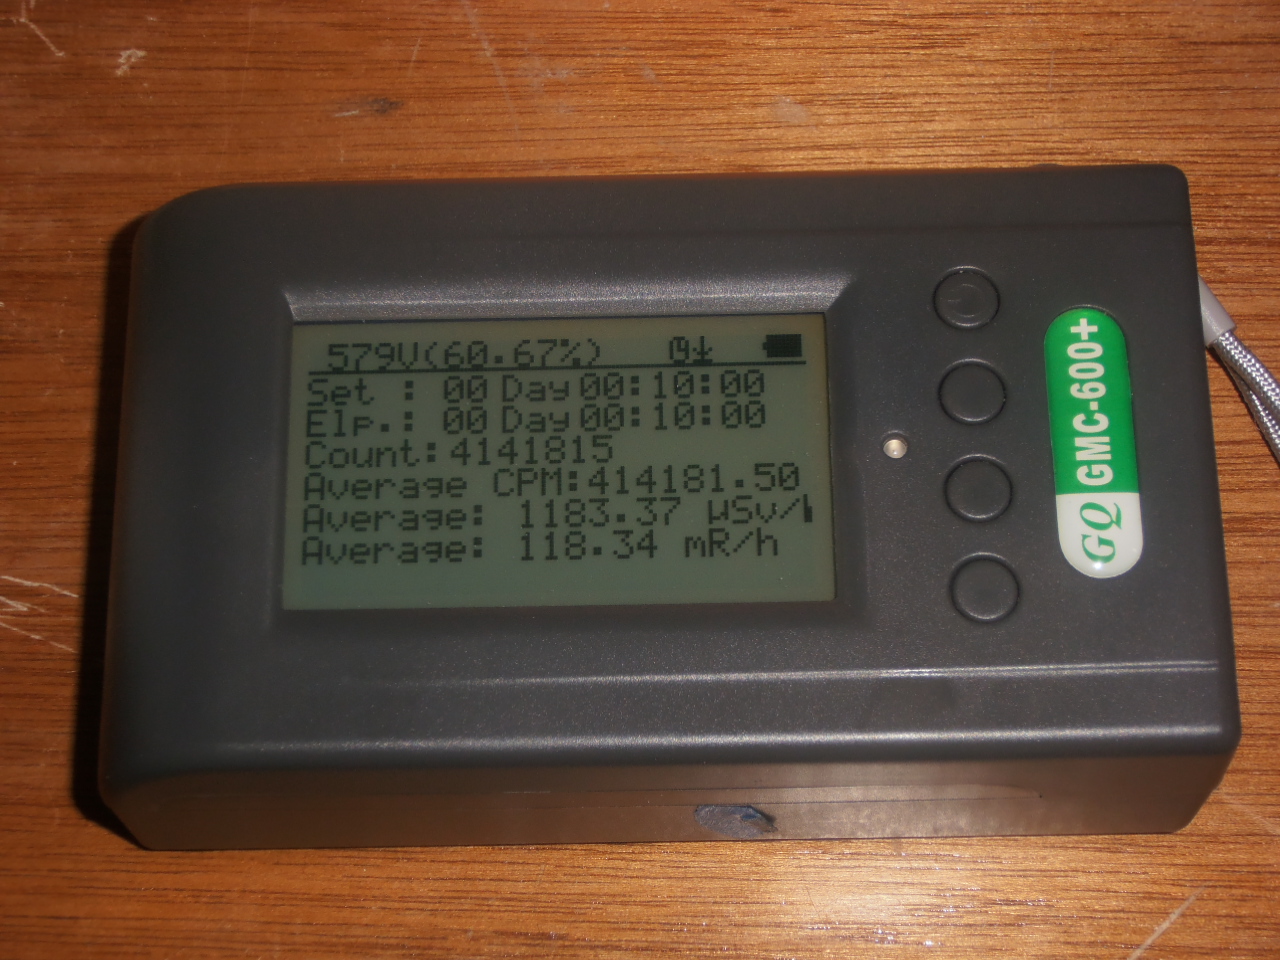
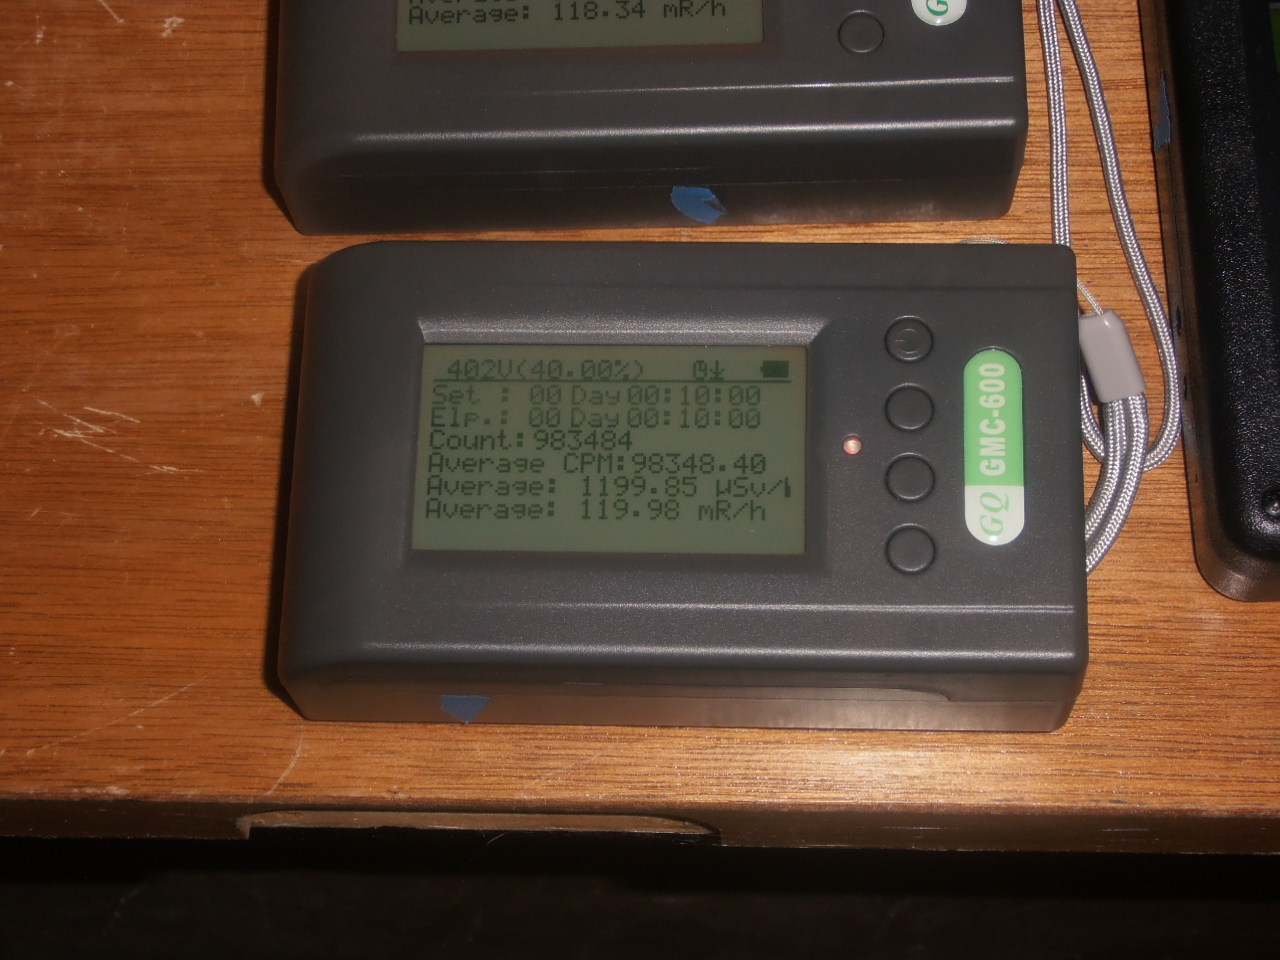
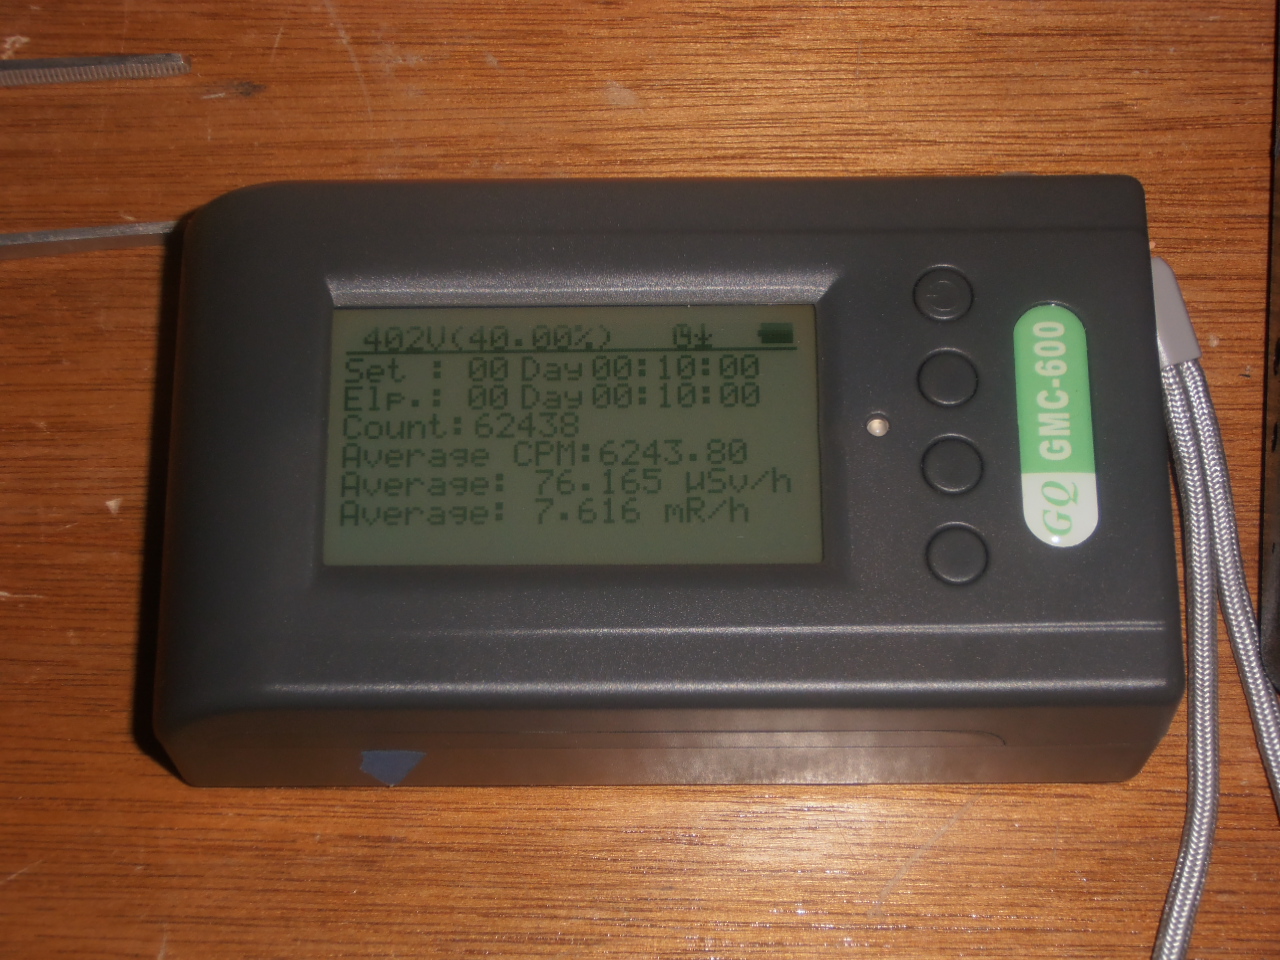
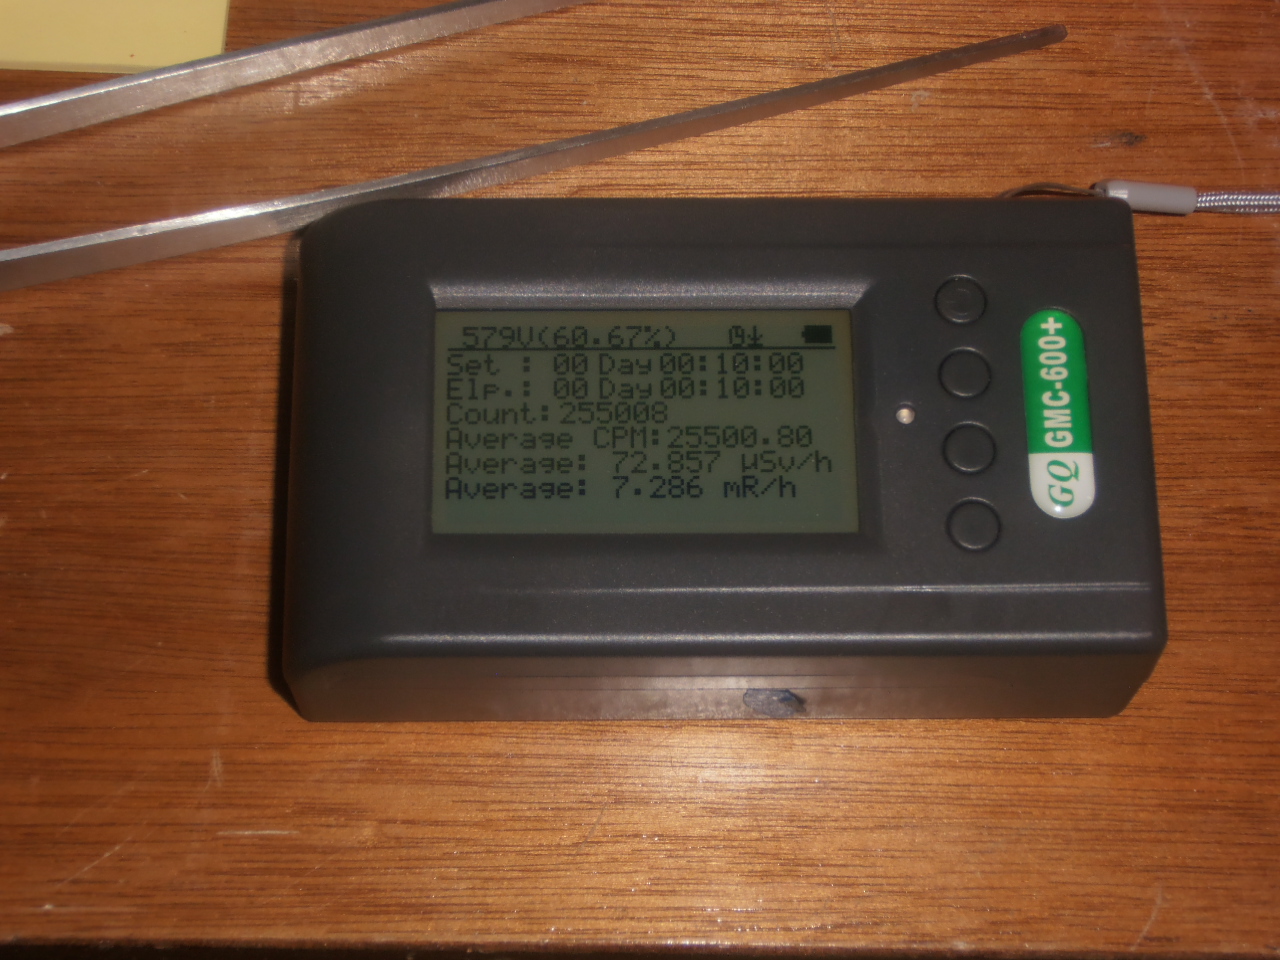
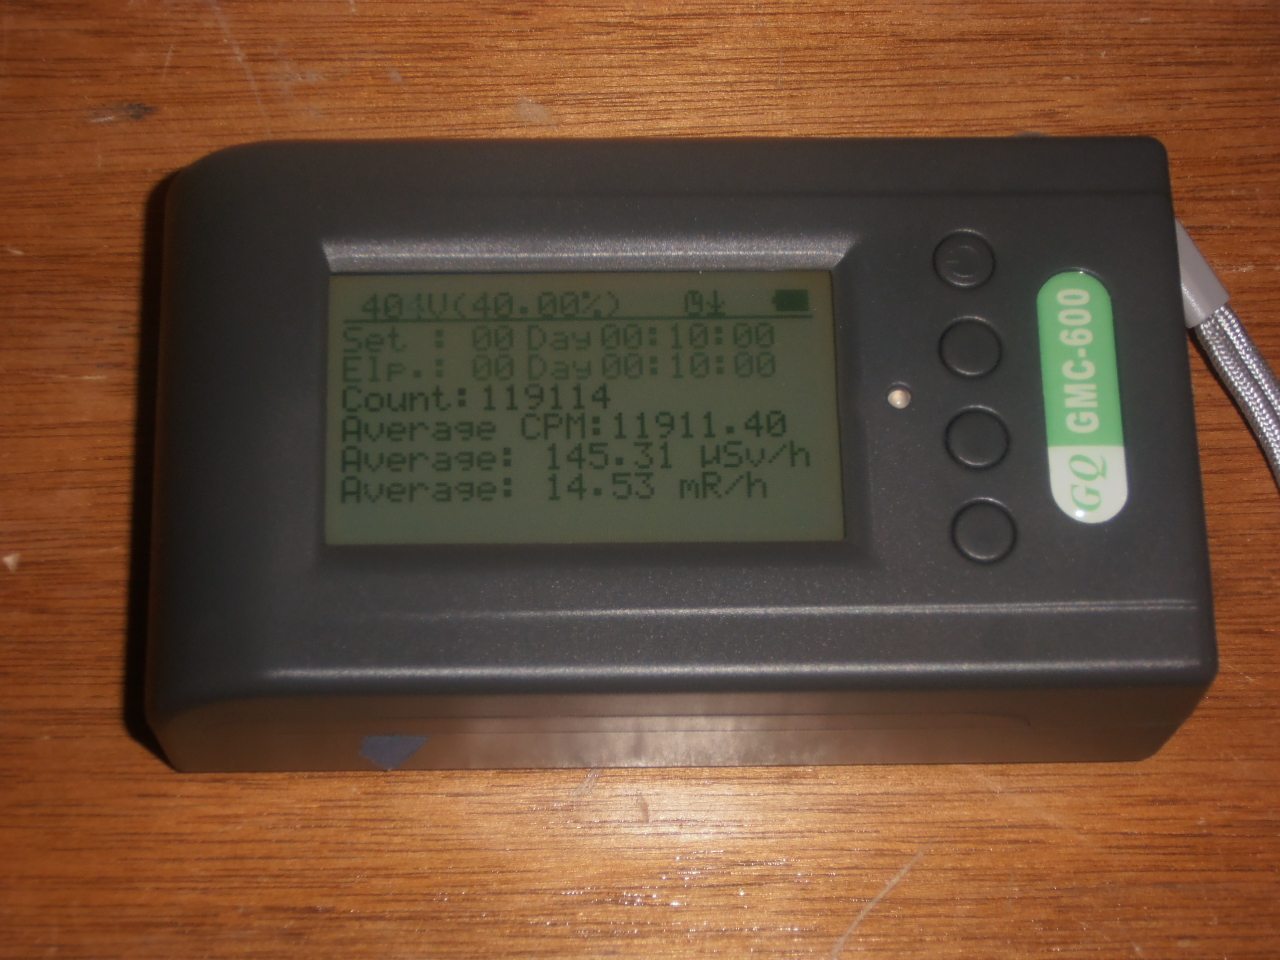
I used a 10 minute Timed Count with a 1 minute delay to insure the meter had adjusted the voltage back to set level. Given that the Mazur is overloaded at Position #1 (>1250uSv) I added another box on each side and created a Position #4. Sources are Cs137 10uCi and 5uCi disks. With dead time delay of 300usec and set voltage at 575V we get excellent agreement with the Mazur meter. When we measure only gamma radiation the 600+ is about 25% higher. And with the AM243 source 600+ is about 29% higher. There is variability with these tubes, which is why lab calibration is important if you have some reason for more accuracy. In general it is important to match calibration procedure at testing facilities and that makes use of the unfiltered Cs137 sources.
Table is followed by screen shots for all the readings. It is recommended to change dead time in 600+ to 300usec.
Image Insert:
68875 bytes
Image Insert:
544661 bytes
Image Insert:
550627 bytes
Image Insert:
543496 bytes
Image Insert:
569127 bytes
Image Insert:
544855 bytes
Image Insert:
560863 bytes
Image Insert:
552454 bytes
Image Insert:
536185 bytes
Image Insert:
516487 bytes
Image Insert:
547328 bytes
Image Insert:
544177 bytes
Image Insert:
557003 bytes
Image Insert:
520842 bytes
Image Insert:
550211 bytes
|
| 4 L A T E S T R E P L I E S (Newest First) |
| Searinox |
Posted - 08/13/2020 : 03:17:23
How do you get the top bar to show voltage? Voltage display only shows percent on mine. |
| Stargazer 40 |
Posted - 09/28/2019 : 16:06:21
Pictures from screens on M4011 somehow got deleted. Will redo at some point.
Here is the testing for SI3BG. I did it a little differently. I used the combination of 2 5uCi and 2 10uCi sources in a roughly 2" square as the source and varied from Pos #2 to #3 to $4 and finally #6. I added info from Pos #6 from 600+ and 500+M4011 to the unshielded numbers but created new tests for the four sources shielded with 3mm of lead and 6mm of plexiglass to give only gammas. Finally in keeping with the attempt to match the performance of the 600+, which is calibrated with the Mazur 9000, I adjusted conversions for the M4011 and SI3BG to essentially match the 600+ reading.
For the gamma response of the 600+ I kept the conversion at 350 CPM/uSv/h but changed the M4011 to 77 CPM/uSv/h to match it. This is between the 153 CPM used for background measures and 11 CPM that would be used for broad spectrum energy sample such as my Cs137 sources. Also to match the 600+ I moved the CPM for the SI3BG up from .881/uSv/h to 1.068/uSv/h. Match is good, and whether you think it fair or not, it's only about a 15% change. Probably not significant given what you might find in the field.
First each meter with shielded sources at different distances. All 10 minute Timed Count. Then unshielded with SI3BG. The shielding should leave about 90% of the gammas. Looks like a lot more betas are getting through the wire wrapping of the tiny GM tube within the tube of the SI3BG. The SI3BG is really a point receiver though compared to the long cylinder of the M4011 and its very small cross sectional area contributes a lot to its insensitivity. I think the two endpoints of 153CPM and 11CPM best define this tube depending on use. Pictures of screens will follow table.
Image Insert:
85900 bytes
600+ Shielded readings:
Image Insert:
139294 bytes
Image Insert:
131132 bytes
Image Insert:
144867 bytes
Image Insert:
137899 bytes
500+ M4011 Unshielded readings:
Image Insert:
133196 bytes
Image Insert:
130772 bytes
Image Insert:
129454 bytes
Image Insert:
130564 bytes
SI3BG Shielded readings:
Image Insert:
132106 bytes
Image Insert:
133201 bytes
Image Insert:
132694 bytes
Image Insert:
130411 bytes
SI3BG Unshielded readings:
Image Insert:
134233 bytes
Image Insert:
132659 bytes
Image Insert:
132237 bytes
Image Insert:
133930 bytes
|
| Stargazer 40 |
Posted - 09/11/2019 : 05:26:29
The 500+ V2 meters with Auto Voltage Adjust have allowed an ever improving ability to characterize the environment for the presence of measurable amounts of radioactivity. The inclusion of a sensitive tube and a much less sensitive tube was the single most important factor in my acquiring the 500+ as my first digital GMC. I have a surplus CDV 717 ionization chamber Survey meter that was okay for pretty intense radiation environment (if you get a reading you probably don't want to stay there). And I have a CDV 700 Sample meter that is the typical GMC with a hand held wand. The two gave me a broad range of measurement capability as to radioactive environments. The 500+ does the same thing and in a number of characterization efforts we've had made by knowledgeable contributors to the forum we know a lot more about the two tubes that are included with the 500+.
The last time I attempted to calibrate the M4011 tube in the 500+ to confirm the 153CPM/uSv/h conversion factor (.0065) used by GQ for the 500+ by comparing with educational sources as above, I got a very different result. The best fit for sample assessment (roughly a point source at some distance from the meter) gave me a 12.5CPM/uSv/h conversion factor (.0833), or roughly 1/12th the count per uSv. We discussed the reason for this difference and now believe it is a factor of tube geometry and tube cross sectional area presentation to the roughly point source. And I was comparing to the results that we got from a sample assessment meter (600+) to get roughly the same uSv response after conversion. GQ determined in their testing that the best match to other background measures was the conversion factor they are using. I confirmed this as well. 153CPM/uSv/h is a good number if you want to have a good estimate of background activity. However many of us want to use the meter as a Sample evaluation meter. That's what my previous testing focused on.
I repeated the tests and added some more for the Cs137 sources and the AVA function in use . I think previous work done with gammas only and alphas are good estimates of response for the M4011 level tube and won't repeat them here. The best fit I have now for the M4011 as a Sample evaluation tool is 11CPM/uSv/h (.0909). The data still show tube geometry effects, but overall I think the M4011 tube can be used as a Survey/Background tube that can characterize the total response within an area by using GQ's 153CPM/uSv/h; or if you desire to use it as a Sample evaluation meter for roughly point sources samples placed beneath the meter at a close distance, then the much lower 11CPM/uSv/h will give a much better match compared to a sample evaluation meter like the 600 or 600+ pancake meters. Making these conversion factor changes while in the field is tedious. I have asked GQ to provide a way to store two conversion factors for Tube 1 and to be able to switch from one to the other through the menu. For now as I have two 500+ meters I will set up one as a Sample evaluation meter and the other as a Survey/Background meter. Meter display images will be added shortly. Position #6 is new and is meant to add a larger sample footprint with four sources in an array. On to the SI3BG tube in the 500+.
Image Insert:
46883 bytes
Here's the setup for Position #6
Image Insert:
139583 bytes |
| Stargazer 40 |
Posted - 08/28/2019 : 17:07:39
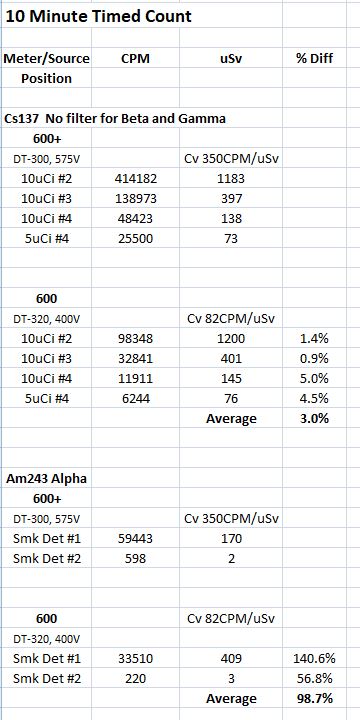
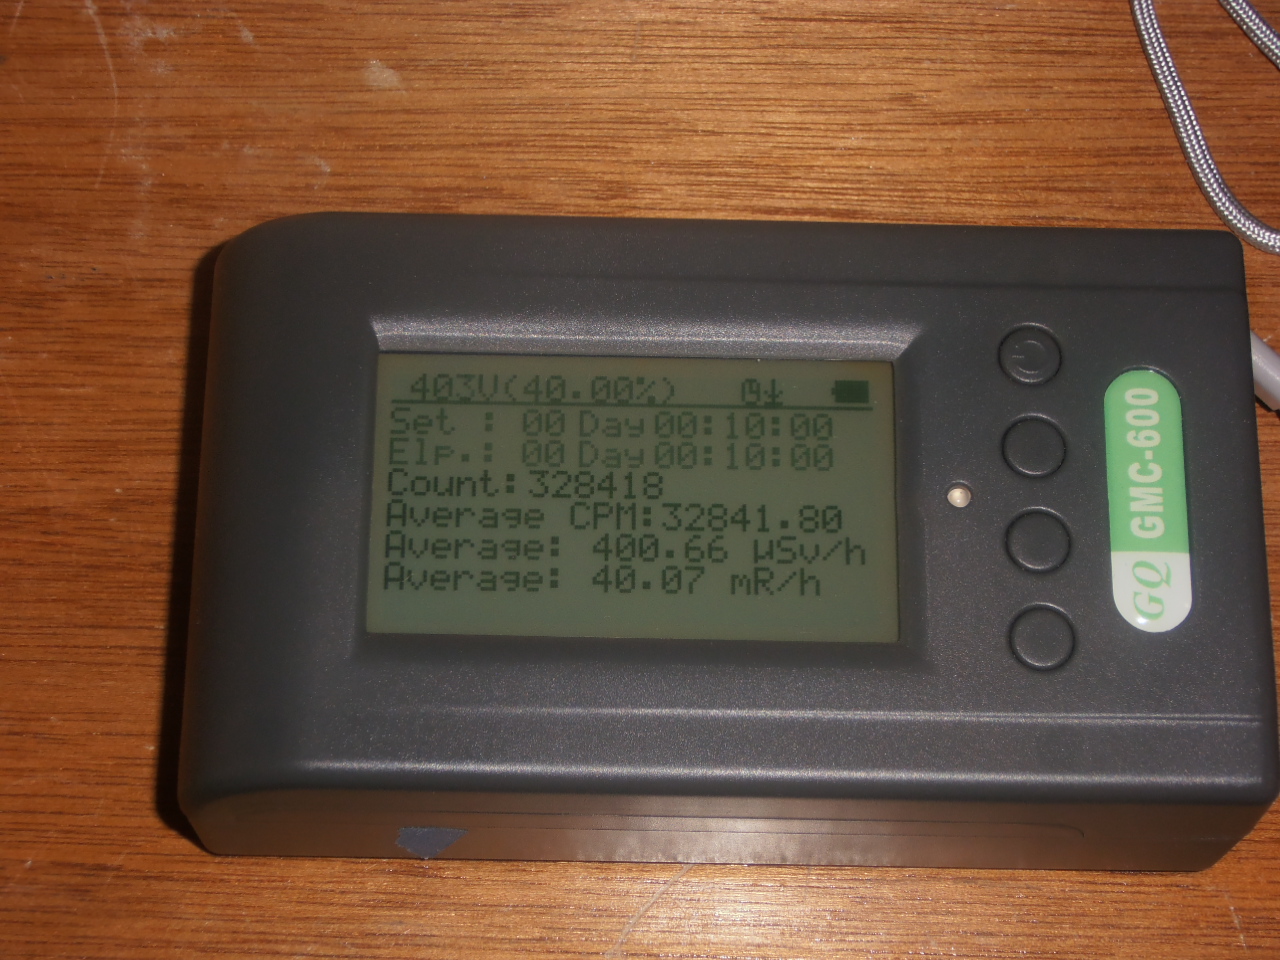
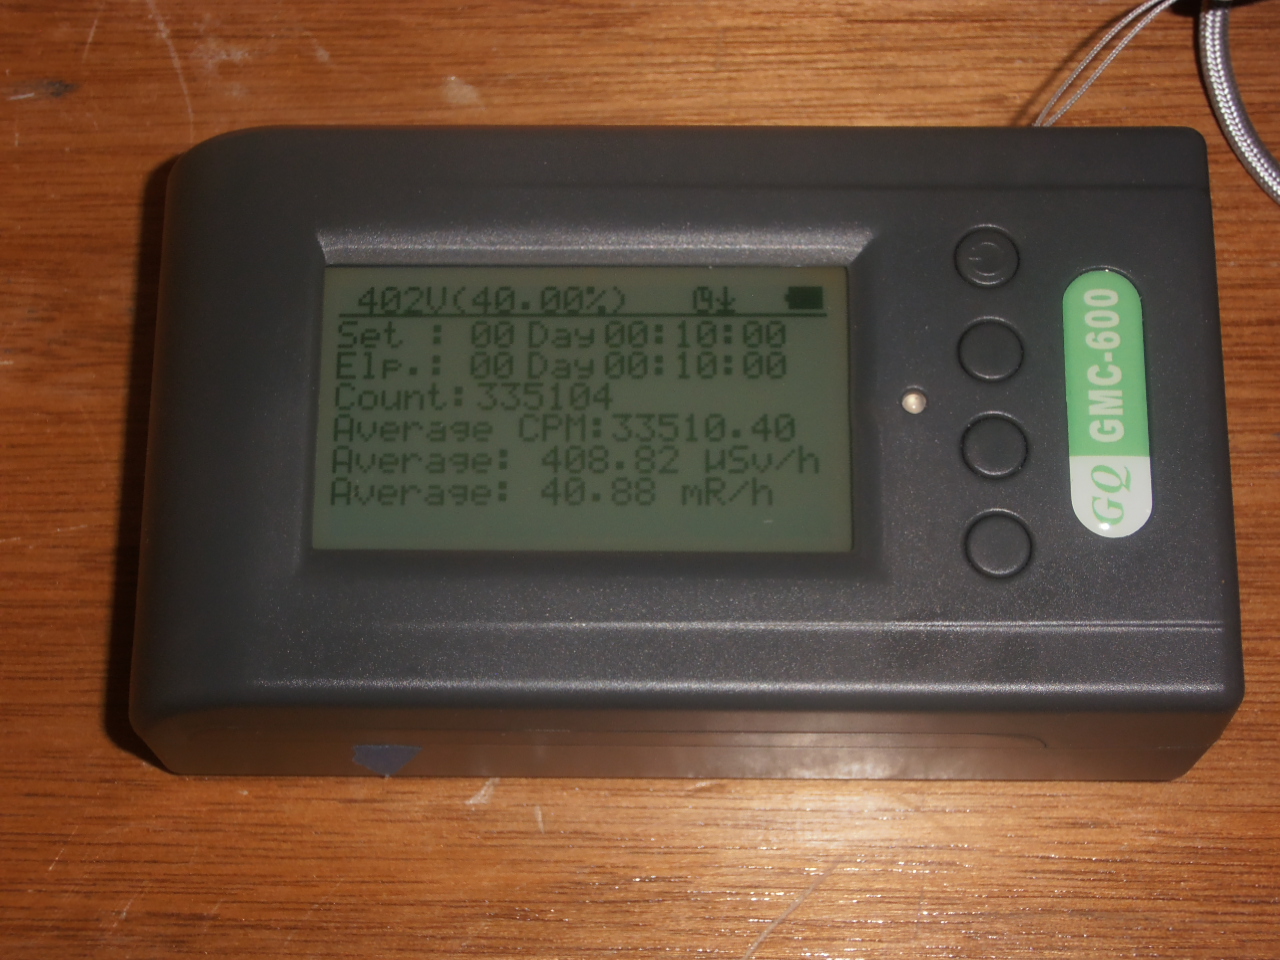
Now that we have good number for Conversion and Dead Time we can use the 600+ to calibrate the 600 and the 500+. We'll start with the 600. And we'll only look at beta and gamma response together, and then the alpha response. The SBT-11A tube in my 600 was about 75% less sensitive to beta and gamma radiation than the 7317. My best fit for conversion is 82CPM/uSv/hr. On the other side of that though is the that SBT-11A is 2 times (on average) more sensitive to alpha radiation. Mine is an SBT-11A and there are reports that the A has a thinner mica window. Whatever the reason, the 600 is more sensitive to alphas (we're not going to change the conversion factor between energies, but if alphas are what you're primarily interested in then 82*2 = 164 CPM/uSv/hr is a better conversion factor). Here's the table for the two sources. Voltage from specs is 400V. Dead time delay best fit is 320usec.
Image Insert:
57451 bytes
Image Insert:
565966 bytes
Image Insert:
554850 bytes
Image Insert:
573353 bytes
Image Insert:
561316 bytes
Image Insert:
554010 bytes
Image Insert:
578110 bytes
Image Insert:
569936 bytes
Image Insert:

564762 bytes
Image Insert:
567673 bytes
Image Insert:
560703 bytes
Image Insert:
571164 bytes
Image Insert:
570114 bytes
|