| T O P I C R E V I E W |
| sinser |
Posted - 11/07/2025 : 08:17:35
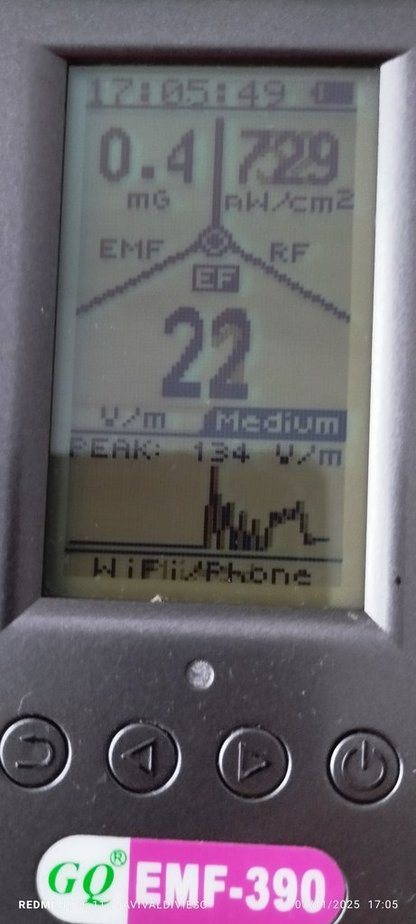
Usually the graph came out fine. But this is already the second time I've noticed it coming out thicker, what does it mean?
|
| 3 L A T E S T R E P L I E S (Newest First) |
| EmfDev |
Posted - 11/28/2025 : 17:39:39
yea they may be a little bit higher RF reading but is pulsing so it looks like it is thicker but it is a few next to each other. |
| sinser |
Posted - 11/20/2025 : 06:52:55
This screenshot (first message) shows the transition between two moments on the device. The new data is appearing. And that made the graph look thicker. I thought the graph widened with intensity or something like that, and that's why I asked, since I couldn't find that information in the manual. |
| EmfDev |
Posted - 11/10/2025 : 18:03:24
Can you take a video of what you mean? we didnt get your question. |