| T O P I C R E V I E W |
| igel |
Posted - 04/21/2023 : 05:10:11
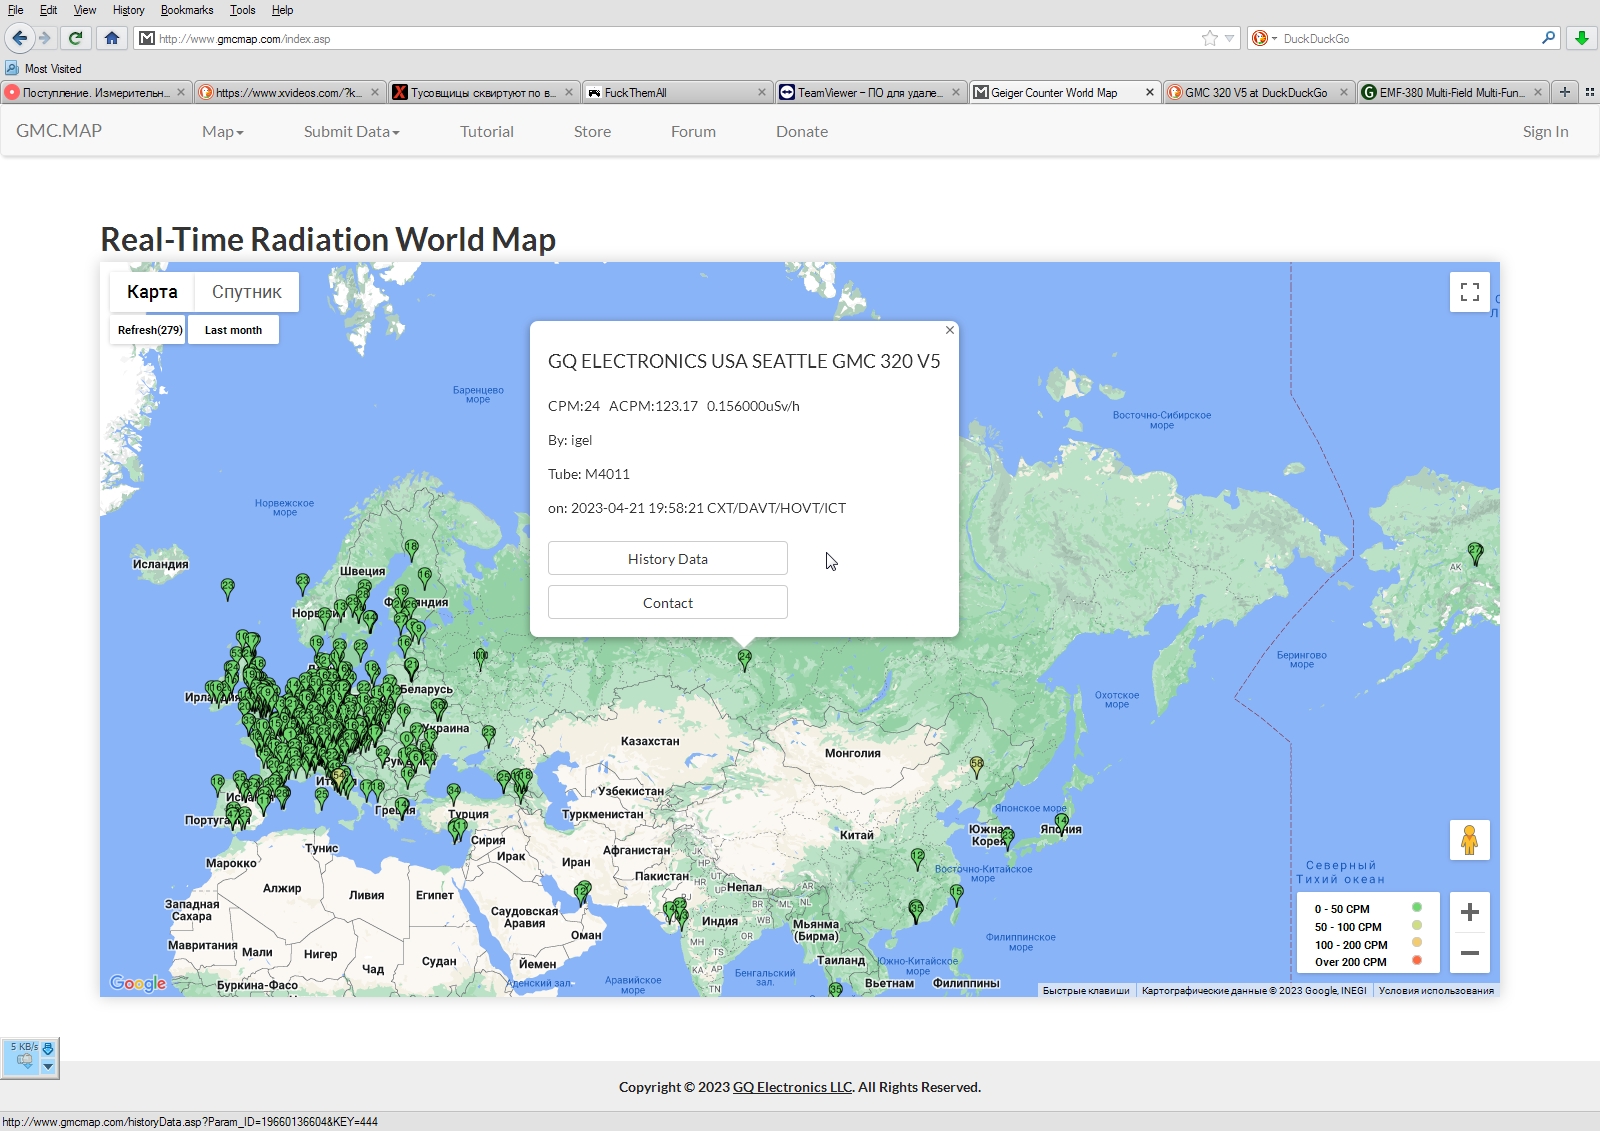
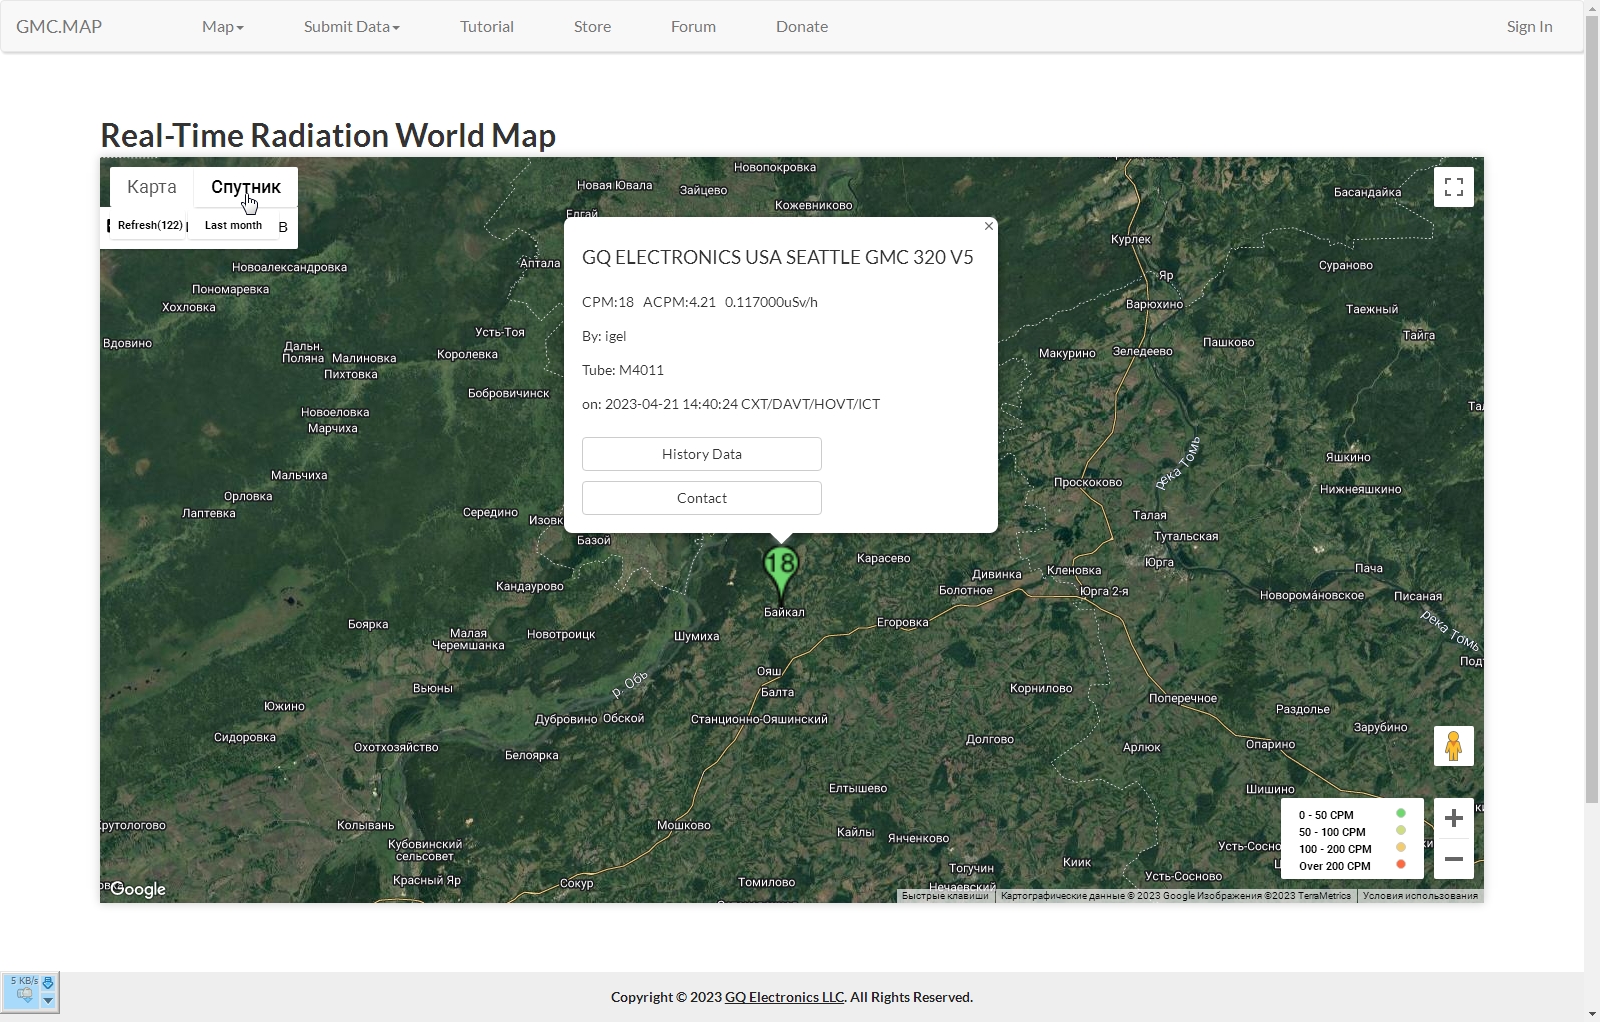
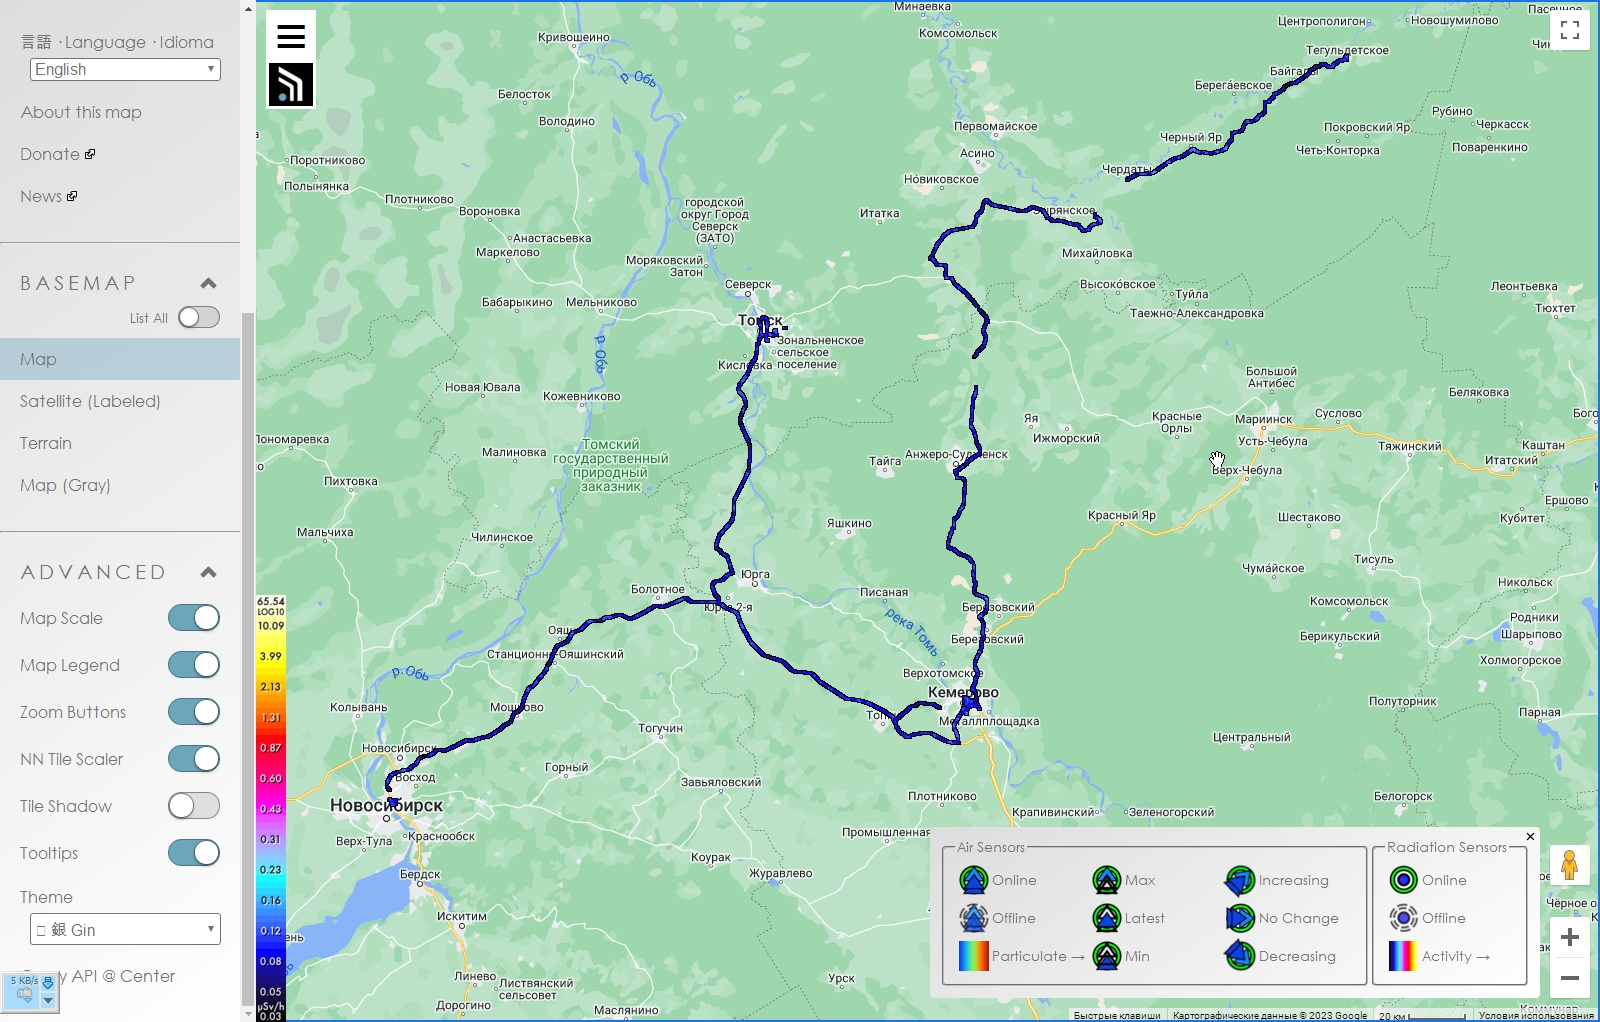
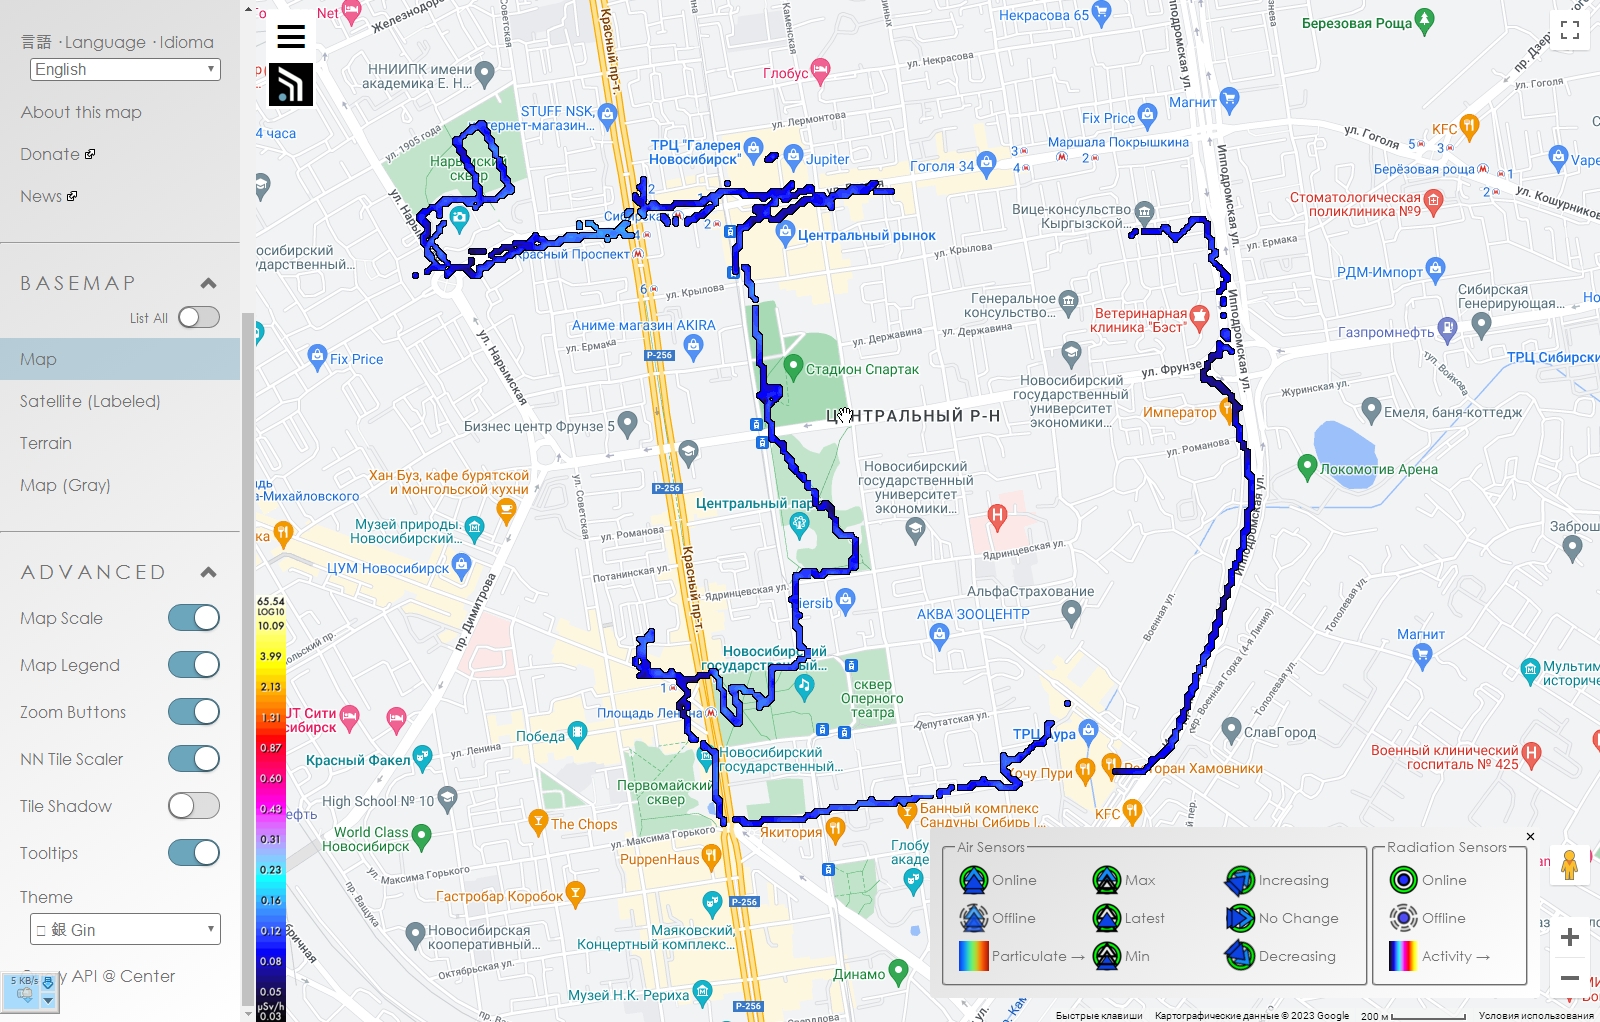
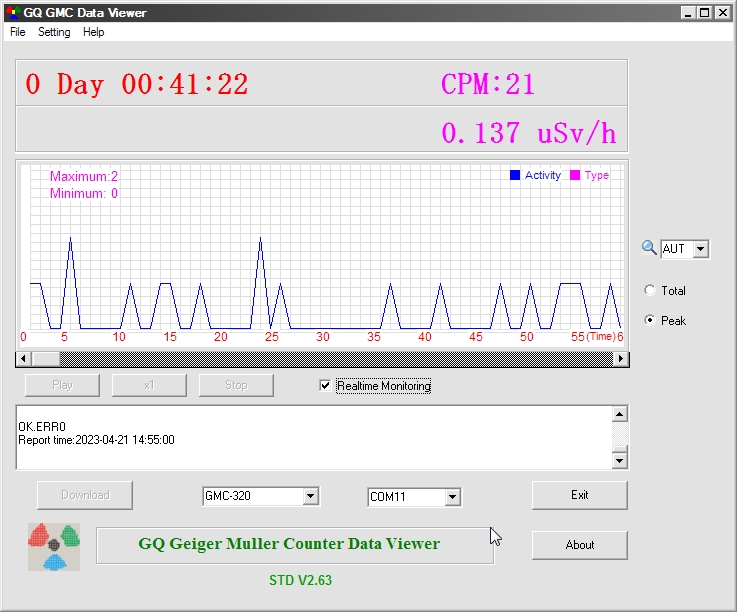
Hi there! I'm try to make track lines with CPM counts. How to do this?
 |
| 8 L A T E S T R E P L I E S (Newest First) |
| igel |
Posted - 04/22/2023 : 05:29:04
I have some idea for solution of topic.. We need some app for android that uses API collect data in CPM and genersted new point on the gmcmap every .. 1min. for example. and we weel see track of blobs on map. Right?
|
| igel |
Posted - 04/22/2023 : 04:57:07
Since 2018, I have been studying radiation from towers and radio stations, metal detector frames and anti-theft. I measure and record both the power and the content of radiation with round-the-clock monitoring. I post all my observations and records on social networks and chats. I create devices for measuring radiation of various models and protection for the head and body. I live in Taiga on a hill, 210m above the sea, which is great for amateur radio. My YouTube channel youtube.com/c/#1025;#1078;#1058;#1072;#1105;#1078;#1085;#1099;#1081; was banned in 2019 for these studies, then restored with a shadowban, but since then I have been publishing everything on VK, Telegram and on my website. Links in the channel header.
Equipment:
Meters of EMI electrical, magnetic, and radio fields (EF, MF, RF):
homemade pointer RF PES UHF + microwave + EHF from 300 MHz to 120 GHz and miniature wristwatches on LED indicator up to 6 GHz with demodulated sound output, and three measurement modes.
american EF+MF+RF GQ EMF-390 from 0.15Hz to 10GHz with spectrum analyzer and 24/7 recording, modified with external antennas and sound output,
chinese EF+MF+RF BR-9 from 0.005Hz with 1.5/3 minute graph modified to 6GHz and sound output,
Chinese EF + MF GM3120 from 20Hz modified to 8GHz and sound output;
Oscilloscopes: home-made JYE Tech DSO-138 modified to two-beam up to 200 kHz and two-beam WAVE-2 up to 200 kHz, Chinese two-beam FNIRSI-1014D up to 100 MHz with modifications, and Soviet-service television combine of Zolochev Radio Plant C1-81 up to 20 MHz and Aktakom USB storage two-channel + spectrum analyzer ASK-3102 up to 100 MHz;
Frequency counters: homemade up to 50MHz, Chinese GY-561 up to 2.5GHz;
Dosimeters: various self-made, American GQ GMC-300E with Wi-Fi marks on the map and Soviet DP-5A;
Receivers: RTL-SDR 10KHz to 1.8GHz, Calex (TDK) 701SS 535~1650KHz, 88~104MHz;
Transceivers: HackRF + Portapack Havok up to 7.5GHz, Baofeng UV-82 radio;
Spectrum analyzers: Chinese TinySA up to 1.2GHz and RTZ up to 4.4GHz and Soviet Arinst SSA-TG LC R2 up to 6GHz;
NanoVNA 2.2 vector antenna analyzer up to 4.4GHz.
In addition to ether research:
Air analyzer 12 parameters, Chemical reconnaissance device VPKhR;
Water analyzer 9 parameters, Test strips 16 parameters;
Sound analyzer Digital sound level meter iCarTool IC-M102 with external microphone up to 50 kHz, pressure sensor from 50 Hz to constant, and seismic sensor;
Light analyzer: Luxometer MASTECH MS6612T with a set of filters + IR, UV. Spectroscope homemade from prisms;
Thermal imager NOYAFA NF-521
Night vision device TZS-2 from the Novosibirsk Oil Refinery with an enhanced searchlight OL-1 and an additional telephoto lens Jupiter 21M 4/200mm
5 microscopes and 3 telescopes will be described later.
Education: Instrumentation and automation 5th category + Teleradio communication + TUSUR Promelectronics, and much more self-education. From 5 to 12 years old he studied chemistry, conducted about 400 experiments. At the age of 12 he collected digital dosimeters (in Ust-Kamenogorsk there was a background of more than 200 microR / h), and from the age of 14 he collected computers: Radio-86RK, Specialist, Spectrum 48/128, Profi 1024+, and then all the production of equipment and parts was ruined and destroyed occupiers, it became profitable only to trade in imports and repair it.
The bottom line is: Not only does the level of microwave EMP on the streets of Novosibirsk exceed the maximum allowable according to SanPiN up to 20 times, I found that some Base Stations, on some channels of the 900 MHz frequency grid, emit sinusoidal Infra-LF waves that have nothing to do with communication , with a frequency of 0.025-18Hz, modulating the carrier. The upper range of these waves coincides with the alpha, theta and delta rhythms of the brain, causing relaxation, apathy and drowsiness. From this as a derivative loss of critical thinking, insanity, submission and fear. It affects everyone differently, depending on the radiosensitivity. In the village, these infra-frequency waves with impulses are turned on at full power from 23 to 8 in the morning, and in the city from 23 to 3-5, which prevents the production of melatonin and causes immunosuppression t.me/informerz/474 On weekends- ROUND THE CLOCK. In different cities, the on and off times vary by several hours, so I think that this is not a centralized control. I also did not find patterns in the time of impulses. An example of these waves can be seen here: EMP measurements in the village of #Baikal, arguing with the head of Kozlovsky: youtu.be/y8TLEqPUzTE Tables of the effects of ELF frequencies on organisms were also studied and shown in my study vk.com/wall51678172_11063 The spectra of the studied waves are also there.
In addition, pulses with a power of up to 500 #956;W/cm2 are produced daily with different frequencies, that is, 50 times higher than the remote control! Most often, they are recorded before the waves of the "coronavirus" disease, which are natural exosomes that remove damaged elements from cells due to such harsh radiation. An example can be seen on my channel t.me/informerz/362 and upon request I can send records by day. While I am writing a program for processing, analyzing and decoding all these signals that are not related to communication youtu.be/er9EC4DUvwo
Also, epidemiologist Igor Gundarov, virologists Stefan Lanka and Thomas Cowen, Stefano Scoglio, Arthur Firstenberg, Dr. Lee Merritt, as well as many other true doctors, who value honor and conscience more than money and work, spoke a lot on this topic: Virusomania t.me/germtheoryisahoax + t.me/ekaterinasugak and the Independent Association of Doctors t.me/associationofdoctors
For confirmation of my research on the effects of radiation, see: Scandal on TV. Igor Gundarov and Channel One went against the Kremlin and the coronavirus youtube.com/watch?v=m-Mnv1bWoGM and study the theory of exosomes, which become DNA fragments from damage to cells by microwave radiation: www.youtube.com/ watch?v=q1EvzUdgfp8 + www.youtube.com/watch?v=rH-nhfQuFTY + www.youtube.com/watch?v=PIzZ_bCTLBc + www.youtube.com/ watch?v=cEcHn1Rfpt4 + The importance of new technologies in the spread of epidemics t.me/informerz/321 + read abundantly here: www.researchgate.net/publication/301944287_Ekzosomy_mehanizmy_vozniknovenia_sostav_transport_biologiceskaa_aktivnost_ispolzovanie_v_diagnostike and lifeimpulse.com news/ekzosomy-kak-element-regulatory-systemy-organizma/
To understand how much radiation harms our bodies, let's turn to the Minin table, according to which, since Soviet times, forensic experts have calculated damage, and SanPiN standards have been used by standardizers. "Known changes in the human body under the influence of electromagnetic fields of varying intensity (Minin, 1974)" sudact.ru/law/mr-21100061-12-2110-sostoianie-zdorovia-naseleniia-v/mr-2.1.10.0061- 12/5/tabletsa-4/
So, even with a PDE of 10 #956;W / cm2, which is considered the norm, we have: Decrease in pressure + Electrocardiographic changes + Changes in the nervous system + Auditory effects + Changes in the stimulus perception threshold + Increased heart rate + Fluctuations in heart blood volume + Decreased ophthalmotonus + Vasotonic reaction with symptoms bradycardia + Deceleration of the electrical conductivity of the heart + Leukopenia + Erythropenia + Changes in the receptor apparatus + Changes in blood clotting + Neuroasthenic syndrome + Asthenia + Changes in the bioelectrical activity of the brain + other changes are possible that were not yet known 48 years ago. But on my channel I have more than a hundred books and articles by Soviet and foreign scientists, academicians and physicians about research into the effect of radiation on living organisms.
Well, at real levels in some houses at night and on the streets during the day, we have: Feeling of warmth + When irradiated for 0.5-1 hour, an increase in pressure by 20-30 mm Hg. + In cases of chronic exposure - stable hypotension + Bilateral cataractogenic effect + Inhibition of redox processes + Pain during the exposure period. Here is the explanation of all pandemics. Given that millimeter waves with a frequency of 60-90 GHz from PRS systems installed on almost every tower interfere with the absorption of oxygen in the lungs due to resonance with hydrometeors, and penetrate through the mouth, nose and larynx along the smallest small bronchi to all alveoli. Where these waves disrupt the process of gas exchange and the vital activity of the alveolar epithelium. That's pneumonia for you.
Plus, on holidays and weekends, impulse signals are broadcast from them, in pauses similar to coded speech. I also record them and write a voice decoding program. As I understand it, these are signals using V2K technology (Voice TO sKull). The prototypes of the technology were Kazinsky's brain radio and the memory and thinking control programs Pure Brain and Radiosleep. There are samples in my VK sound recordings. About these impulse principles of influence on the brain and all other organs and cells - The full version of the program on the Day channel - The fatal spectrum. The frequency of technology versus the frequency of man. V. Kiseleva. D. Peretolchin. www.youtube.com/watch?v=sV2KvOToZ7o
Plus, around the clock, ultrasound is produced with a frequency of about 20 kHz to all sound amplifying devices - from home speakers to loudspeakers in shops, transport, and outdoor public address systems. This is easy to identify with the Spectroid application, and by creating a horn to determine the direction of the source.
As I noticed from the extracts from the on-load tap-changer database, many of these BSs do not have any parameters at all in their design documentation - power, frequencies, communication protocols. Moreover, they are not defined as cell towers in network monitoring applications and do not even have a Cell-ID number in the tower databases. I described how to find any tower in the OLTC database in VK. There's also a post on how to legally deal with providers.
I am trying to understand with my research by whom and why these signals are produced, and how they can be blocked. Since the towers began to be destroyed in different countries, and even in our village they have already been fired upon several times. Since after their installation in the villages, all the bees died out and most of the birds disappeared. And this led to big crop failures. Plus, dozens of people with increased radiosensitivity come to me, who physically feel these radiations and impulses as tingling, burning and convulsions. So far, I can only help them by means of shielding their homes and bodies.
On my website, I have collected posts from the VRTP, electronix, GQ Electronics (in English) radio forums, and others bajkal.ru.nf/forum/viewforum.php?f=16 There you can read in more detail about my measurements, documents on the BS, methods, knowledge, reasons for moving to Taiga from Novosibirsk, answers to "frequently asked questions" and trolling, for which the forum elder Grandfather Shagen later apologized personally (on the last page).
By order, I produce indicators of microwave fields on pointer heads to study the ether around us for radiation and to check the means of protection against them. Their main advantage over the rest is that they do not require power, they measure accumulation, they have a sound output by which the type of radiation is determined, and recording is carried out for monitoring and spectral analysis. Description on zen, video there in the comments zen.me/Rnvnn I also produce resonant circuits in the form of crowns to protect the head, respiratory organs and heart (they suffer most from radiation). Video of their check in the same place.
I would be grateful for any advice and cooperation! It is difficult for me to explain technical issues in simple language to a large circle of viewers, I hope for your help.
My YouTube channel Yozh Tayozhny, after a dozen videos with measurements, where I analyzed these strange waves, has been blocked for a couple of years - every 3 months the block is extended and new videos cannot be uploaded.
I sent this message to all the bloggers I know by email over three hundred channels and no one even answered except Anna (Awareness raising channel). Everyone is afraid. Removed from forums for the same reason. All the media and hundreds of bloggers refused to publish these facts, I think because of venality or cowardice. That their income from the channel or reputation will drop, they will unsubscribe, they will write jokes about foil hats, they will block, or they will call the fascist organs of the invaders for a conversation. Loot and fear now rule the world. And all this foulness is happening not because the evil uncles and aunts are engaged in genocide to depopulate peoples, but because 99% of the rest fearfully endure all this and silently agree.
I will add that everything described below has long been proven by instruments and tested in several cities and different countries.
My main questions are:
1. InfraLF sinusoids in tower emissions - what are they and where do they come from? Why do they have the most power? Why does their power increase before the waves of "covid"?
2. V2K impulses - who broadcasts them and why? Previously, I recorded them only on holidays and on election days around the clock, after the creation of a pandemic and before the waves of "covid" - daily at night.
3. Why does our tower, like some new ones in neighboring villages, have no Cell-ID and no SIM cards and no monitoring programs see it as a cellular one?
4. Why in the acts of RosPotrebNadzor these rural towers do not indicate frequencies and capacities, as for urban ones?
5. Why is power sometimes overestimated many times, and at night it is pulsed by orders of magnitude from PDN according to SanPiN? Up to 500 µW/cm2, as I showed on round-the-clock graphs.
6. Why is there TWO towers of one opsos (MTS) in a village for 100 people, when the connection is caught from the towers 12-20 km away on the highway and the nearest cities? After turning it on, even among MTS users, the connection deteriorated. I believe it is interrupted by these waves and impulses.
7. Why are all these signals on all village towers, but not on all urban ones that broadcast the connection?
IMPORTANT call from Yozh Tajozhny (radio engineer Vyacheslav) about chemtrails, towers, the USSR and shadow prepayment for housing and communal services:
Call to the Green Line of Ecologists
youtu.be/hP9p0S0Qwe8
Link to the channel of the author of the call: www.youtube.com/c/YozhTayozhny also VKontakte vk.com/igelizm
And here is the continuation - details about scanning and correspondence with the air traffic controller t.me/informerz/213
Interview with an Israel Defender about my measurements and how to protect:
Hedgehog Taiga "rebuke from radiation" #9762;#65039;#11093;#65039;
t.me/informerz/788
t.me/informerz/787
If you have answers or want to help, discuss - visit:
t.me/igelizm - PM
t.me/igeliztz Group Yozh Tayozhny - personal group for feedback, communication and discussion of news
t.me/informerz ETH STUDY CHANNEL #128225;#128223;measurements, observations, discussions, inventions of new devices, repetitions of my articles and video releases
t.me/ecoists Protection from genocide- We are ecoists! We are looking for and discussing protection from radiation, radiation, chipization, biometrics, chemtrails, pharmaceutical medicine, chemical food industry, occupiers, legal, economic and physical genocide of peoples and ecocide of nature
t.me/novosibirsk_ecoists Novosibirsk - ecological situation, radiation measurements, maps of critical areas, technological accidents, protection methods
t.me/legal_sativa #128513;#129305;LEGALIZE#127796;GIFTS#127793;EARTH#127757;#127811;#129428;
|
| igel |
Posted - 04/22/2023 : 04:31:22
quote:
Originally posted by ullix
GeigerLog can do this. https://sourceforge.net/projects/geigerlog/
Either by reading history from the counter, or from a Dataviewer generated *.bin file. Not from the dataviewer's CSV file, which uses an awkward format.
7300 CPM? in waves? I doubt that this is real. Perhaps electromagnetic disturbances?
I have not recently bin to your area ;-)) is there anything "nuclear" nearby? Power station, Deposit, Research, Hospital, whatever?
Here is much stuff. PS, Nuclear institutes, Rocket shafts, Seversk- disaster stronger than Chernobyl, deposites and mines. But never was that level. Max was 100-120 CPM waves often at nights.
EMF-390 was silent. And i need soft that separately views EMF and GMC logs. And even better if logs air quality and UV+IR data from my lab. |
| ullix |
Posted - 04/22/2023 : 04:07:25
quote:
How can I visualize history .csv to graph? Is there some application convertor / viewer? Thank You for attention!
GeigerLog can do this. https://sourceforge.net/projects/geigerlog/
Either by reading history from the counter, or from a Dataviewer generated *.bin file. Not from the dataviewer's CSV file, which uses an awkward format.
7300 CPM? in waves? I doubt that this is real. Perhaps electromagnetic disturbances?
I have not recently bin to your area ;-)) is there anything "nuclear" nearby? Power station, Deposit, Research, Hospital, whatever?
|
| igel |
Posted - 04/22/2023 : 03:23:06
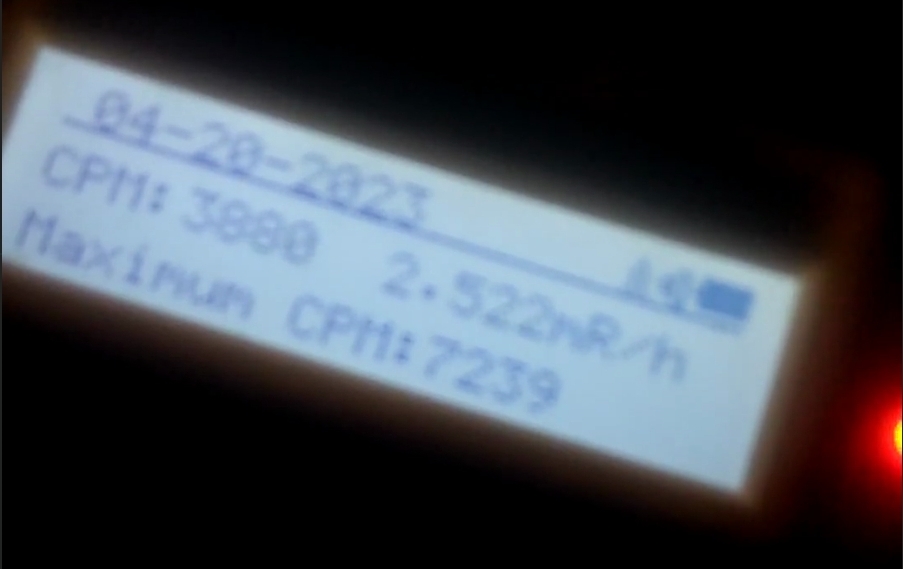
I living in Siberia Location: 55.64477991787362,83.88079748092373 and detects up to 7300 CPM waves 10-15 minutes long. Video: t.me/igeliztz/26994
How can I visualize history .csv to graph? Is there some application convertor / viewer? Thank You for attention!
www.gmcmap.com/historyData.asp?Param_ID=19660136604&KEY=648 |
| igel |
Posted - 04/22/2023 : 03:19:42
|
| igel |
Posted - 04/22/2023 : 03:16:35
quote:
Originally posted by EmfDev
If you GPS has a timestamp, you can map the timestamp from the CPM with the GPS and plot them together.
Thank You! But is there some application that use cell phone GPS? Or how to connect GMC-320+ with map.safecast.org ?
And how to view logs from gmcmap and internal memory as graph? |
| EmfDev |
Posted - 04/21/2023 : 16:20:32
If you GPS has a timestamp, you can map the timestamp from the CPM with the GPS and plot them together. |
|
|

