| T O P I C R E V I E W |
| iiimendous |
Posted - 05/08/2022 : 13:26:52
Hi,
I am wondering if anyone has encountered a problem where the charting software sporadically leaves out the time and date markings, and if so has anyone been able to find a solution?
It doesnt happen on all of the charts for some reason, but seems to occur a few times even thought the data is all there.
Thanks in advance of any helpful solutions. |
| 6 L A T E S T R E P L I E S (Newest First) |
| iiimendous |
Posted - 06/01/2022 : 13:00:39
Yes I can send you that file, or any of the hundreds of files I have downloaded. This thread was just wondering if there is a trick (that im missing ) to get the charts to include the time if i split the data, most likely just a bug in the software though.
The other thread is wondering how im getting such high rf spikes. Sorry for posting seperate threads but I though asking both at same time would make the thread too long and confusing ... |
| EmfDev |
Posted - 06/01/2022 : 12:48:58
Yea sure I can take a look, it is the same one as you replied on another thread? |
| iiimendous |
Posted - 06/01/2022 : 12:43:43
Thanks for the reply,
i have the data downloaded there can send it across if you would like to look at it?
K
|
| EmfDev |
Posted - 06/01/2022 : 11:34:57
Not sure if this software has been updated, can you please use the EMF PRO software to download the history data? |
| iiimendous |
Posted - 05/31/2022 : 16:54:44
Hello,
sorry I have only just seen you reply now.
For some reason my data doesn't graph correctly every time. Sometimes it doesn't add the times on the y axis even though they are in the source data.
The especially happens when ever I try to edit the original data. For example if I have logged data over an 8 hour period, but only want to chart certain portions of the data, I will save a new file and delete the irrelevant data from the source file.
The graph then often plots as expected but usually without the timestamps on the y axis. This does also happen with some of the unedited downloaded data sets too , and I cant figure out why this is happening . I have attached a pic to try show you what i mean.
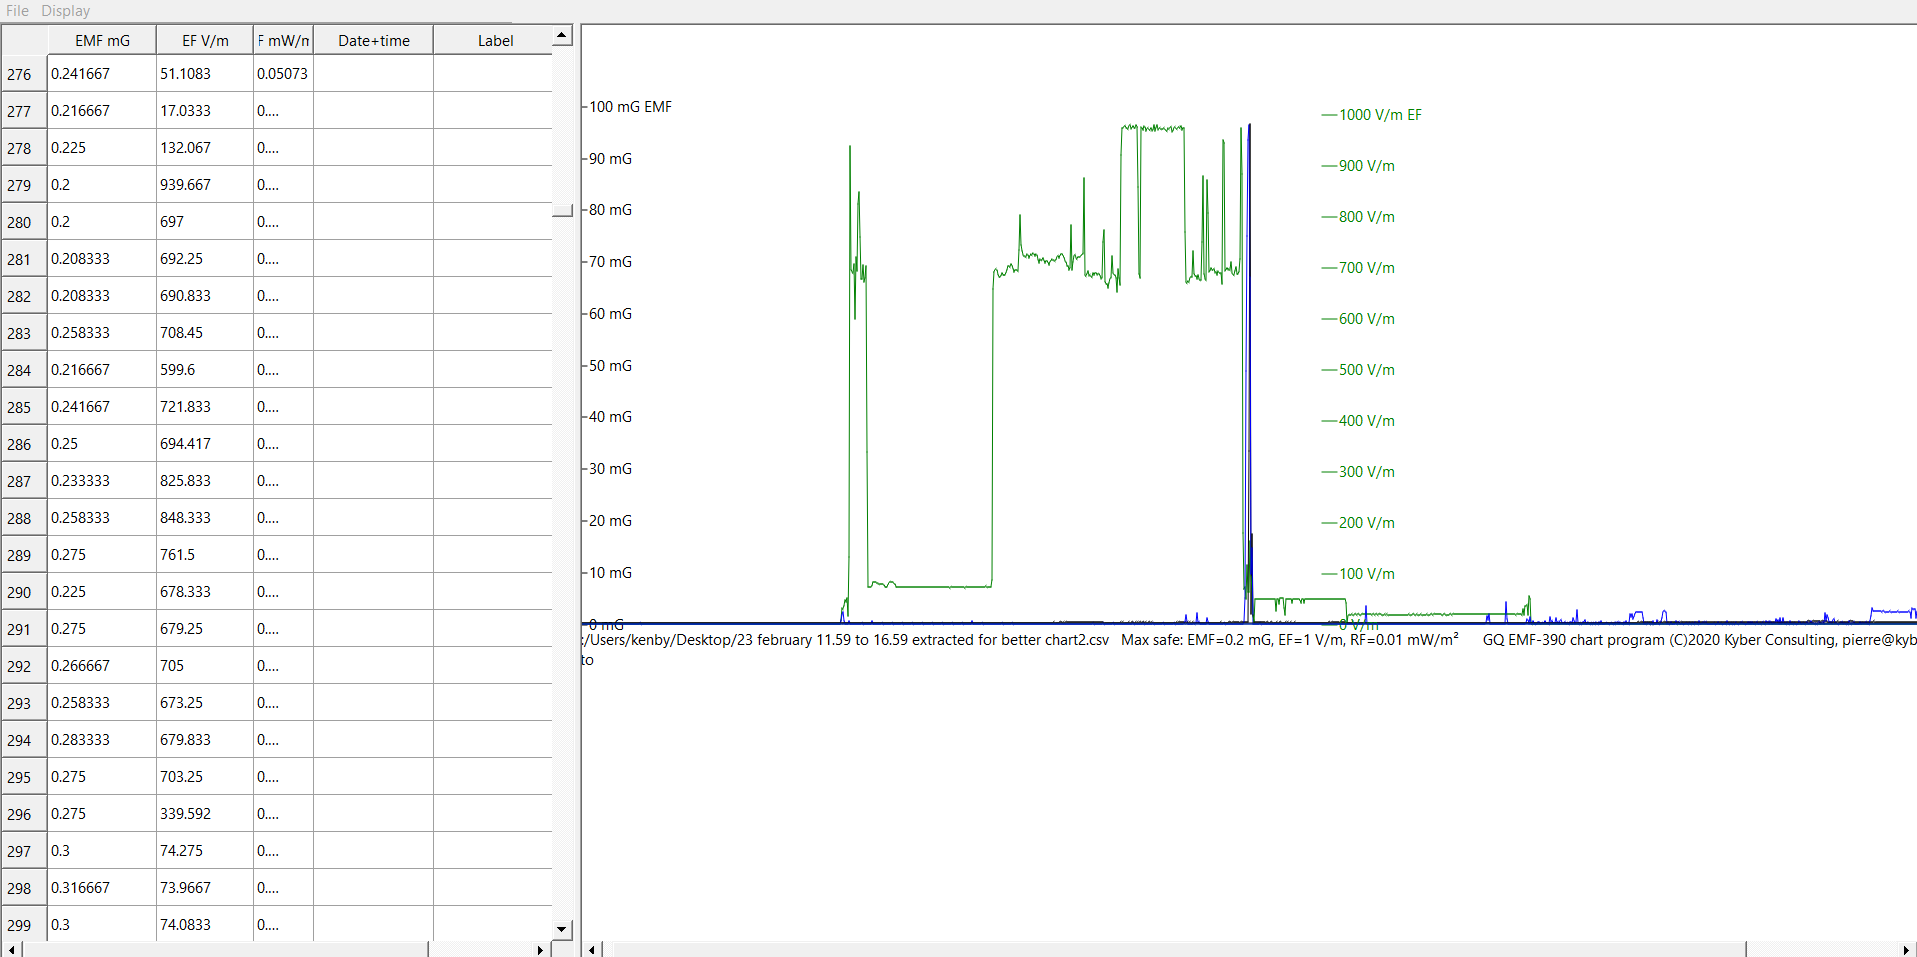
Here is another example: In this data collected the readings in the first 30 minutes of logging were so high, and rf hit 250mW/m2 which effectively renders the rest of the more normal readings unreadable as they appear almost like a flat line on the chart as they are much lower that the peak.
Here is the original chart:
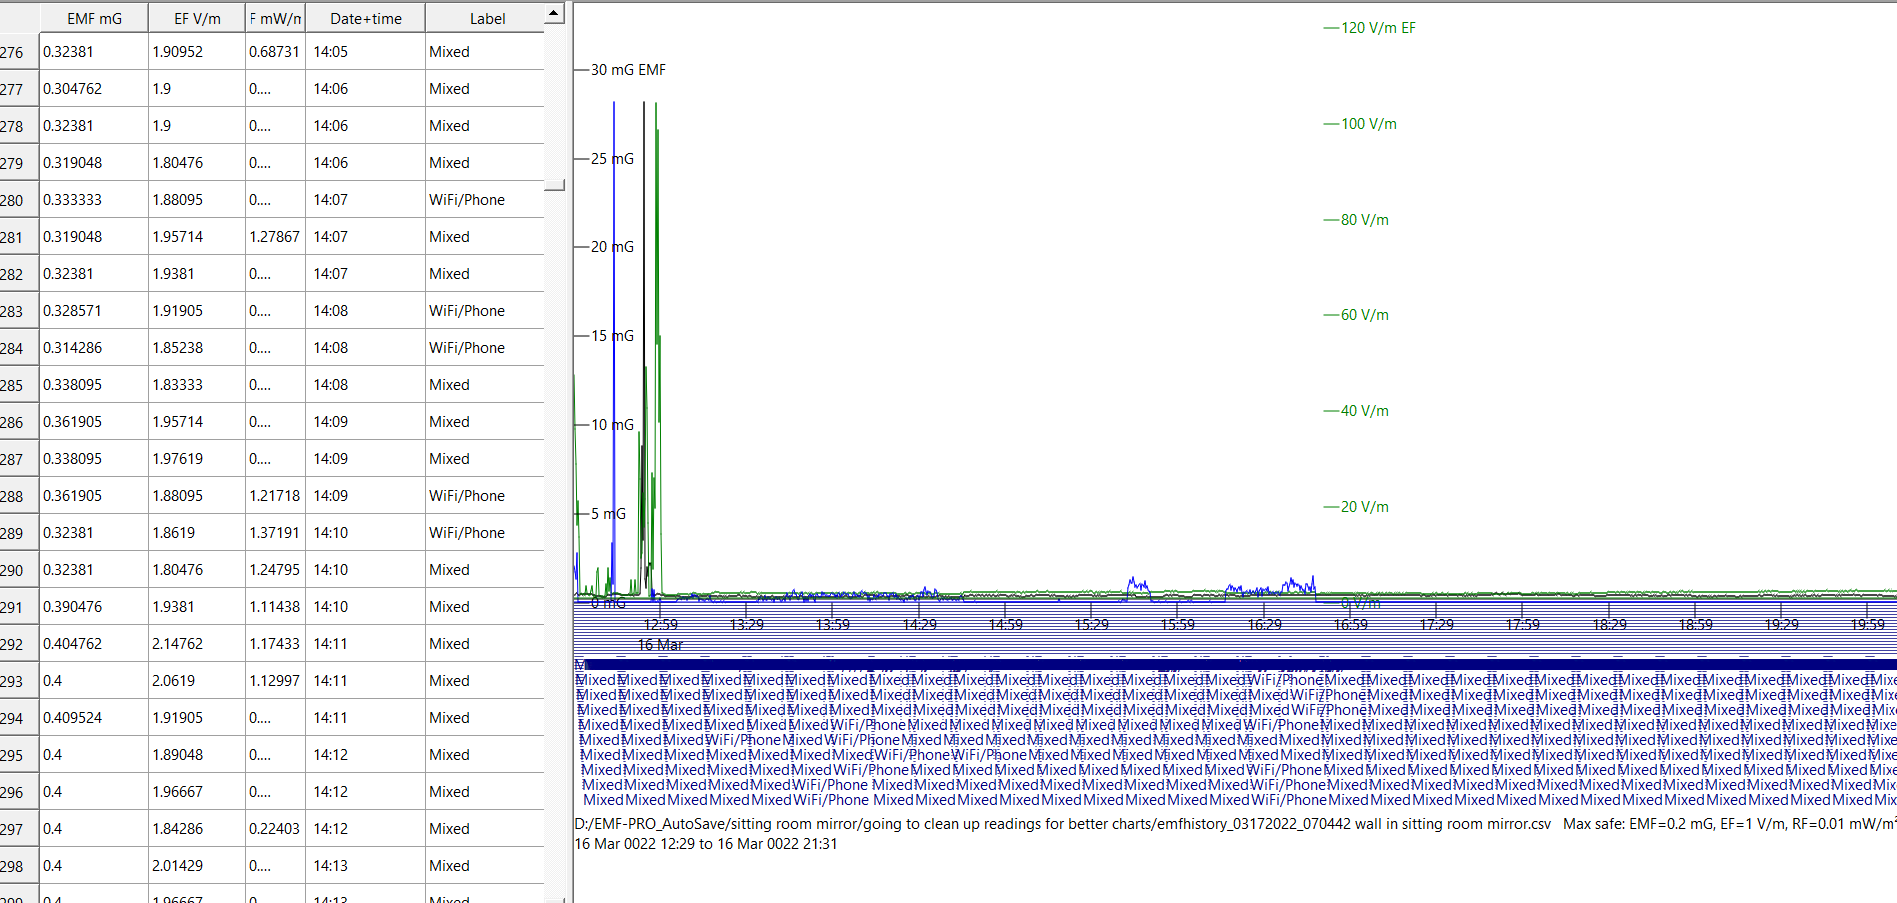
So to make the data more readable, I decided to copy the data file and first delete the data from after this 30 minute period and chart it separately and get a chart like this but its now missing the time on y axis. I did add the time in remarks on some areas but this is very time consuming.
Heres the image obtained after deleting the data after the first 30 minutes in order:
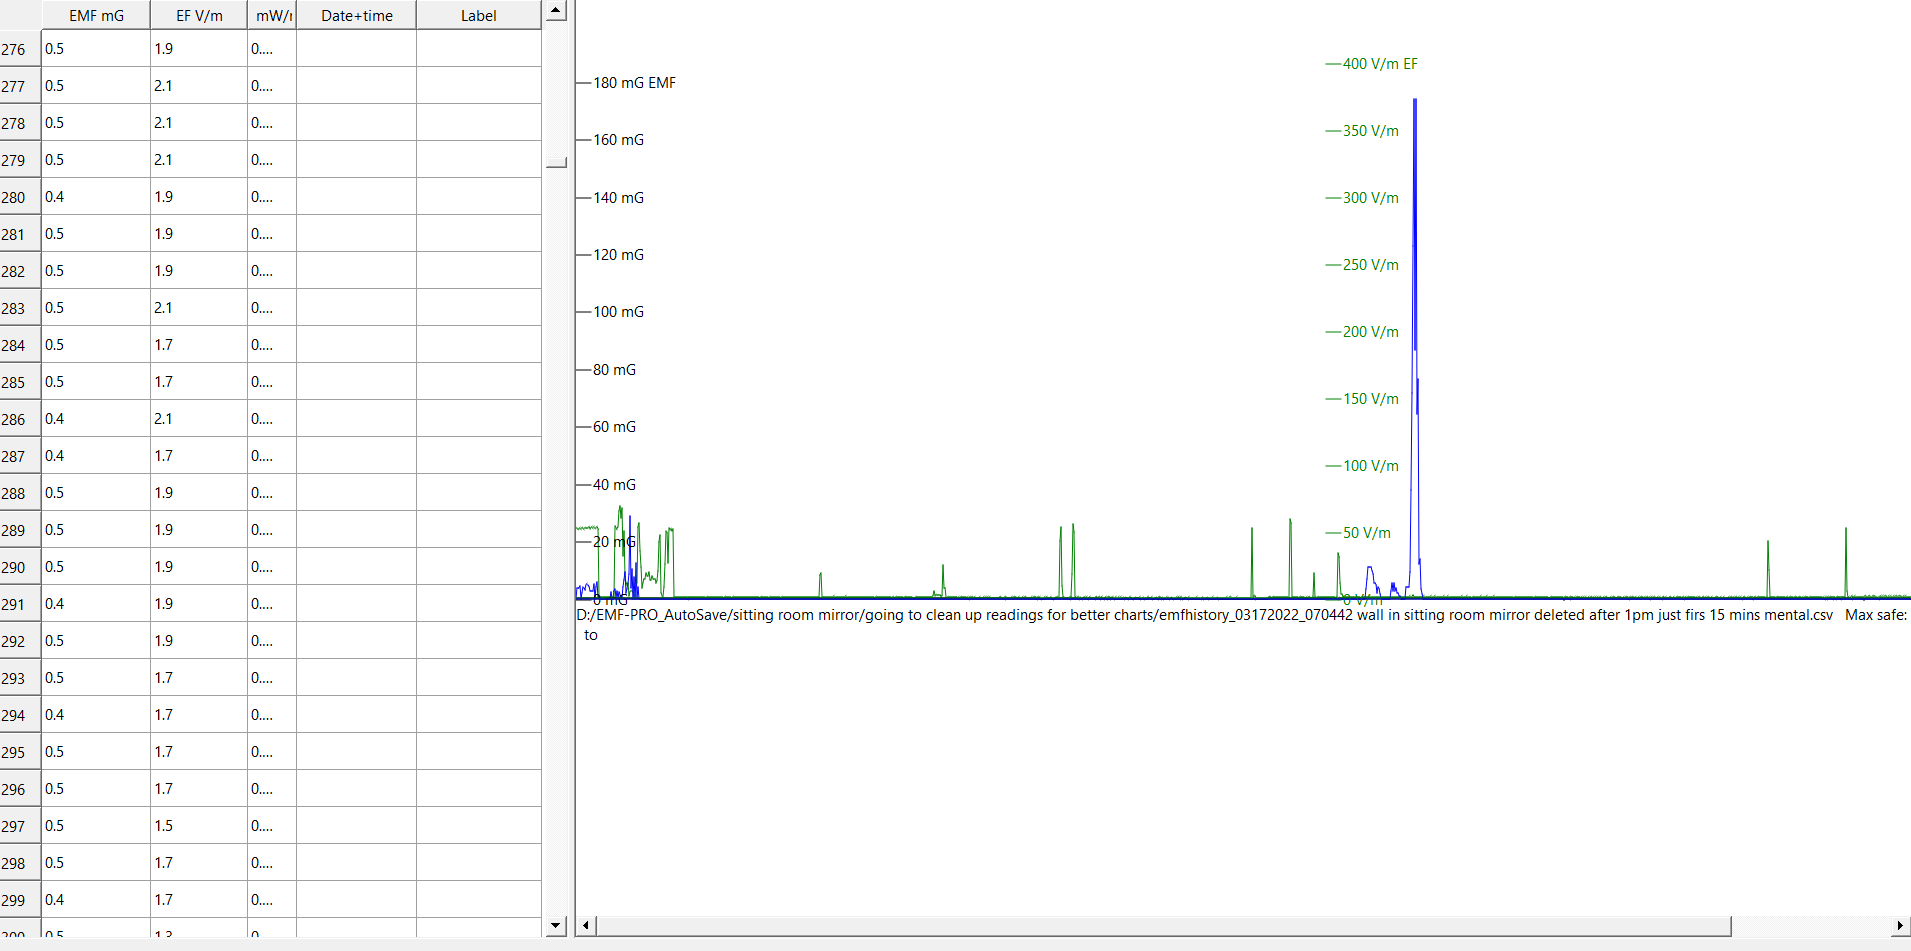
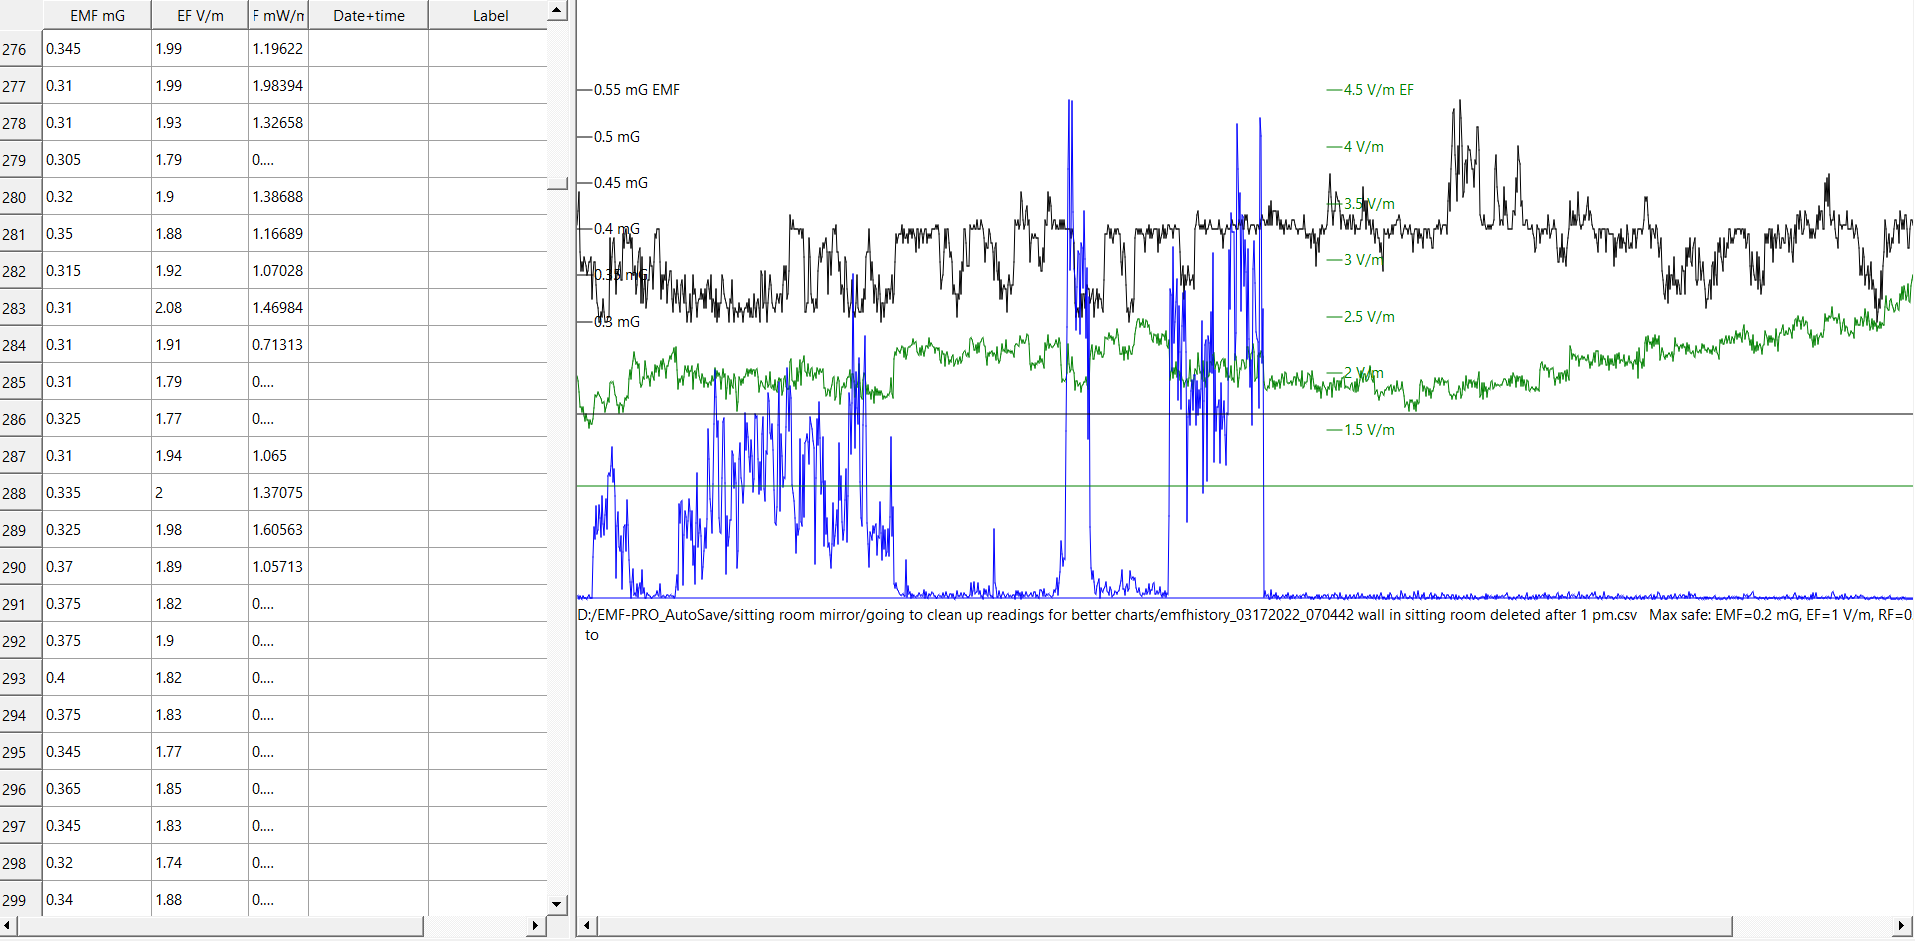
I then took the original data set, and deleted all the data of the first 30 minutes collected, leaving all the data collected in the following areas. In the resulting spreadsheet all the data is still there , time date, readings values and remarks but the resulting chart doesnt import the timestamps or the remarks.
It does still chart the data and make the lower values far more readable , but again the times are missing.
I hope this explains whats happening, and isn't too confusing. I'm really stumped as to why this is happening.
Thanks
k
|
| EmfDev |
Posted - 05/10/2022 : 09:33:50
Hi iiimendous, are you talking about the .csv file? How does it leave out the time? |
|
|