| T O P I C R E V I E W |
| mpmdembi |
Posted - 03/27/2016 : 08:18:00
Is there any simple solution to generate graph (for example as the end of page http://www.gqelectronicsllc.com/comersus/store/comersus_viewItem.asp?idProduct=4579 )?
Analyse of csv or bin file without graphics is very difficult.
Best regards |
| 3 L A T E S T R E P L I E S (Newest First) |
| ZLM |
Posted - 03/30/2016 : 16:37:14
you should open the data file as .csv.
Post your data file here. I do it for you. |
| mpmdembi |
Posted - 03/30/2016 : 10:10:36
Thanks for help, but it doesn't work with my csv.
Problem is, that generated by my version (2.30) of data viewer csv is different that yours. I have everythig in "A" collumn. Please look on attached screenshot.
Image Insert:
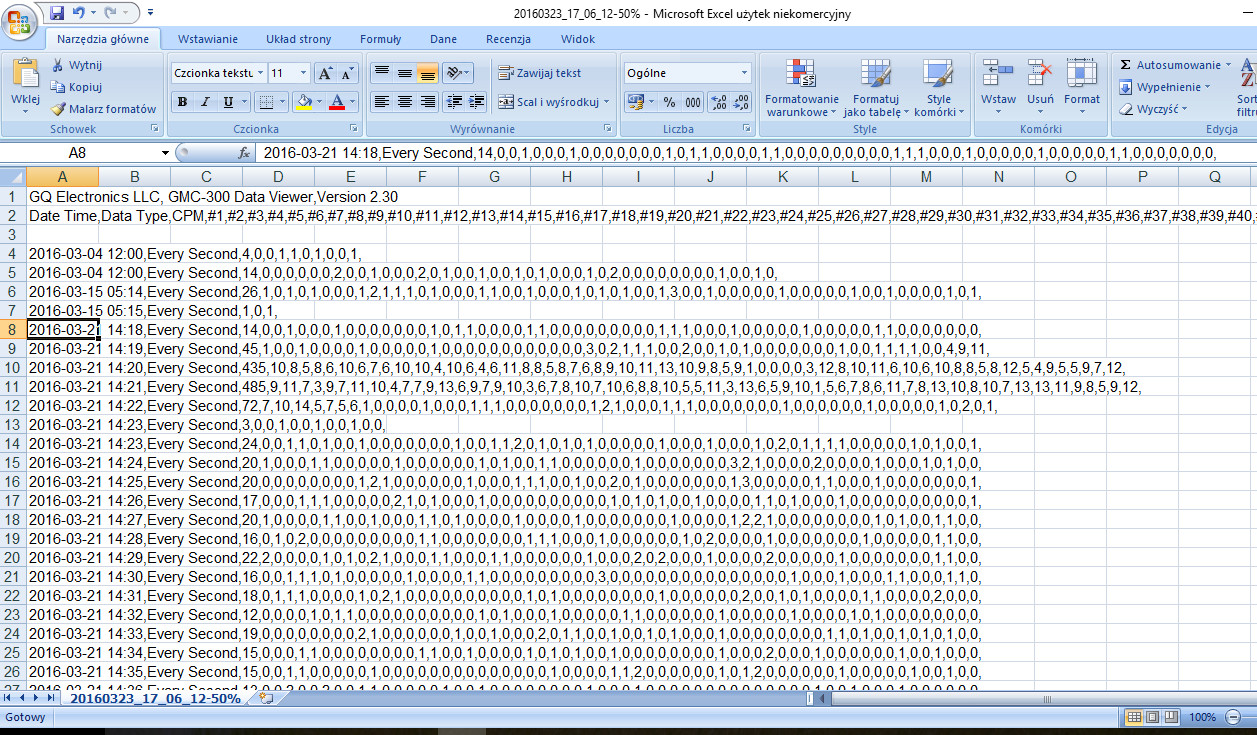
700662 bytes |
| ZLM |
Posted - 03/28/2016 : 15:43:59
The graph normally is depending on the software you have.
I am using MS Excel spreadsheet software. It has graph wizard, you can just highlight the data you want to generate the graph and then click on the graph wizard icon.
Here are the steps:
1. open the .csv file from Excel software.
2. highlight the data columns you want to show on graph. here is the Date and CPM.
3. click on the Graph wizard icon
4. select line format
5. finish
[b]Step 1: Load the CSV file[/b][br]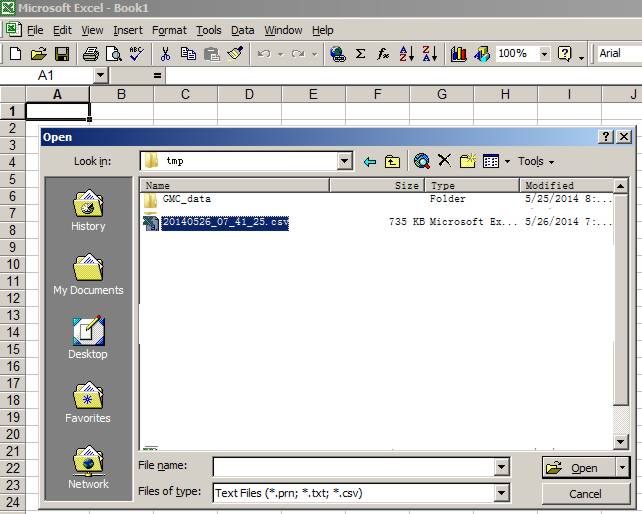 [br][size=1] 51.95 KB[/size=1] [br][size=1] 51.95 KB[/size=1]
[b]Step2: Highlight the data you wanted(Hold CTRL key and then click on column letter cell. Here are A,C columns.)[/b][br]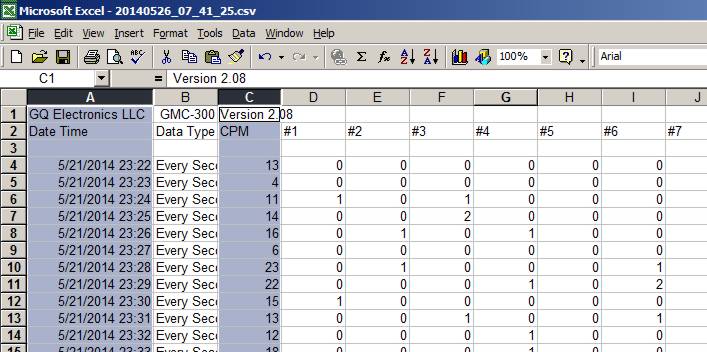 [br][size=1] 57.92 KB[/size=1] [br][size=1] 57.92 KB[/size=1]
[b]Step3: Select graph wizard from toolbar[/b][br]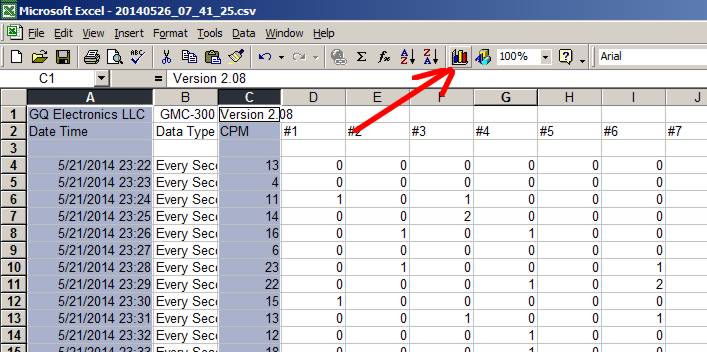 [br][size=1] 57.92 KB[/size=1] [br][size=1] 57.92 KB[/size=1]
[b]Step4: Select line format from graph wizard[/b][br]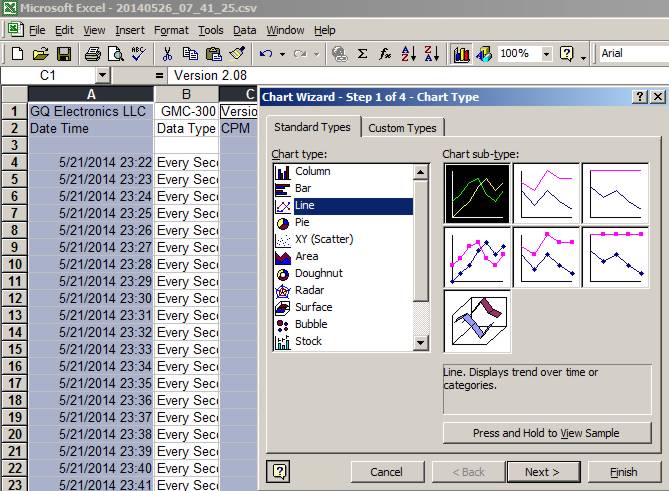 [br][size=1] 57.92 KB[/size=1] [br][size=1] 57.92 KB[/size=1]
[b]Step 5:[/b][br]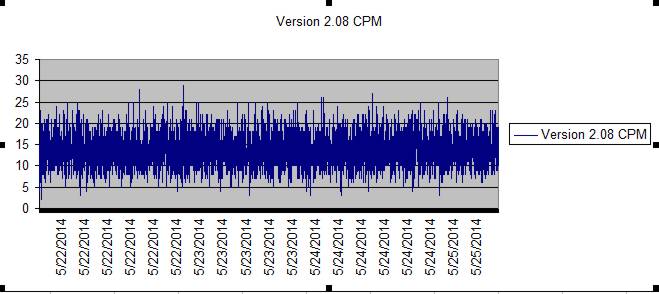 [br][size=1] 36.81 KB[/size=1] [br][size=1] 36.81 KB[/size=1]
|